
OilVector X MT5 Review: Oil Breakouts, Live Signal and Broker Risk
OilVector X MT5 trades WTI crude oil using daily breakout levels, with a structural stop loss, fixed take profit and early breakeven management. It adds oil-market exposure to an automated portfolio, with an on-chart statistics dashboard and configurable evaluation-account risk controls. Our assessment: a clearly defined oil breakout approach offers a different market from the usual gold and FX robots. The main considerations are broker sensitivity, limited live trade count and the developer’s disclosure of a previous VPS-related protection failure.
View OilVector X MT5 features and current pricing

- Developer source link: OilVector X on MQL5
- Live signal link: OilVector X oil-only signal
- Portfolio signal: XYZ Fund A — eight EAs, not OilVector alone
Sources checked 16 September 2026: current developer listing, all four original gallery images, both linked public signals, seller page and customer-review/comments sections. This is a source-based assessment, not our own traded test or code audit.
How the oil breakout approach works
OilVector X is presented as a daily-level breakout system designed to capture upward oil momentum. Each trade is described as carrying a structural stop loss and fixed take profit, with breakeven reached quickly when price moves favourably. The developer explicitly rules out grid, martingale and other recovery methods; that remains a developer claim, not a conclusion from inspecting source code.
The chart timeframe is stated not to control strategy timing. A timer fallback handles periods without ticks, and saved dashboard/prop-mode state persists after removal or restart. A timer cannot operate while the terminal or VPS itself is off. There is no public entry-level formula or manual linked; the listing says the setup manual is supplied privately.
Broker selection is part of the strategy
The developer prefers Darwinex oil conditions and names IC Markets/IC Trading as alternatives. We have not independently benchmarked those venues. Oil CFD specifications vary, so compare tick value, contract size, minimum lot and volume step, spread, swap and session interruptions. The same numeric lot size need not mean the same exposure at every broker.
For testing, the listing asks for the broker’s WTI symbol, real ticks and a deposit of at least 1,000. It says one-minute OHLC and real-tick tests matched closely on IC for 2025–2026, then suggests longer OHLC tests may be useful. That short-period comparison does not prove all historical OHLC runs reproduce real execution or the order of intrabar stops and targets.
Oil-only live signal: 52.41% growth from 30 trades
Signal2384131 is marked as a real account and displays CapitalPointTrading-MT5-4, leverage 1:500. The developer calls it the IC Trading variant. At the check, a 1,000 EUR initial deposit had become 1,524.11 EUR balance and equity, with 524.11 EUR profit and no subsequent deposits or withdrawals.
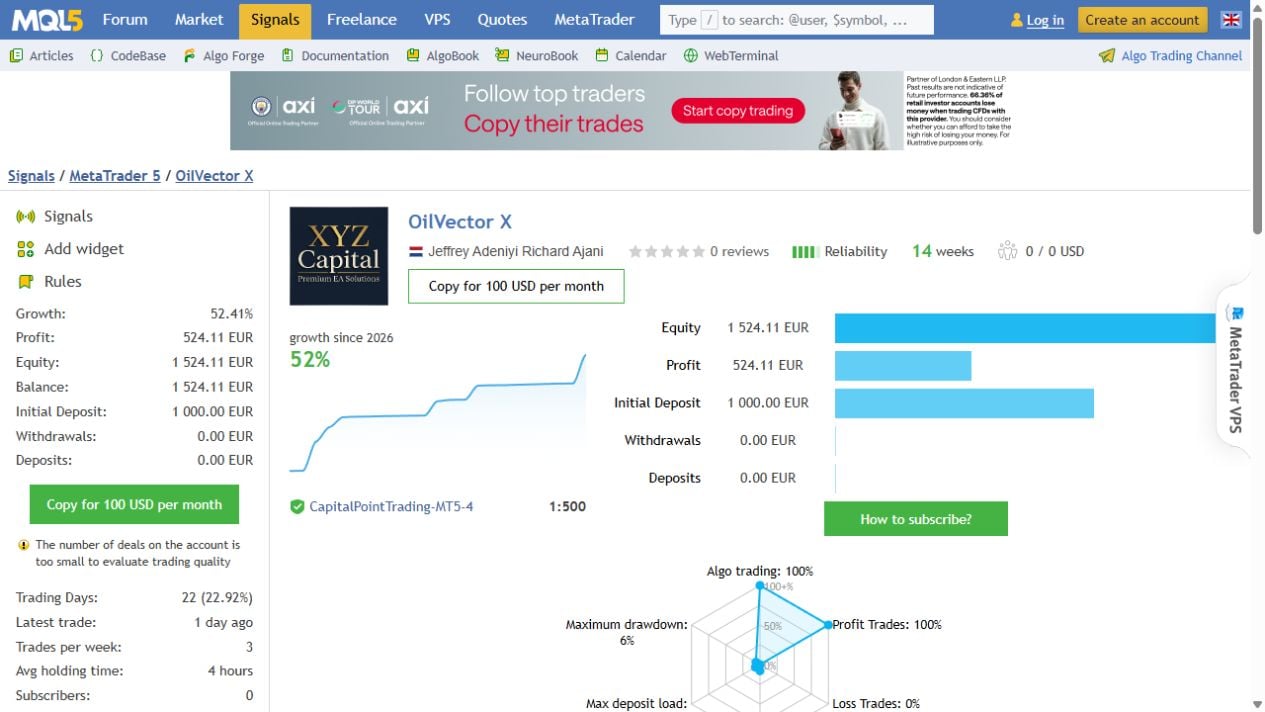
- Growth: 52.41%; 14 weeks shown, with MQL5 monitoring started 29 July 2026.
- 30 closed trades, all long XTIUSD positions; average holding time about four hours.
- Relative balance drawdown 0.00%; relative equity drawdown 5.99% (83.37 EUR).
- Maximum deposit load 6.81%; approximately three trades per week.
- MQL5 displays a too-few-deals warning; its history also records concentrated-growth and inactivity notices.
The account history reaches back before monitoring began and before the 28 August retail publication. It is not fourteen weeks of independently observed trading of the current retail build. The 30 profitable trades give a 100% closed-trade win rate and no calculable loss-based profit factor, not an assurance of zero future losses. The equity drawdown shows that adverse movement occurred despite no closed losing trade.
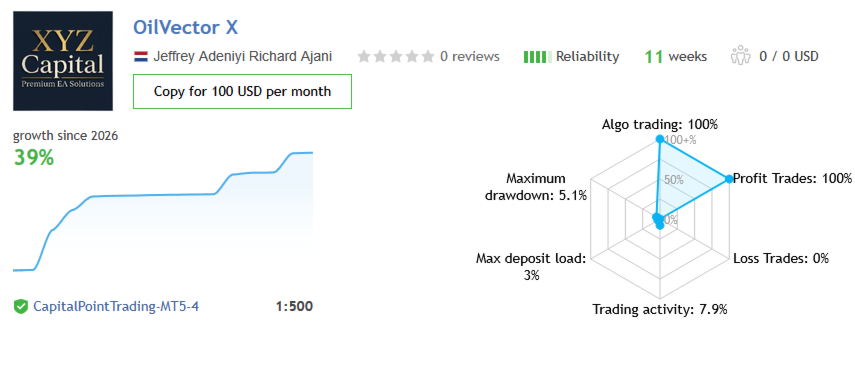
The developer gallery contains an older 39% growth/5.1% drawdown image. It is included below as historical source material, not substituted for the current figures.
The removed Darwinex account deserves context
The current listing says a VPS shutdown led to unprotected trades on the Darwinex signal account and that the developer took that signal down. The public listing does not provide the complete removed record or quantify the resulting losses. We cannot reconstruct them from the remaining account.
This disclosure needs to sit beside the claim that every trade has a stop from entry. The available text does not explain precisely which protection failed or whether a remedy was made. Verify actual server-side stop placement, terminal-dependent breakeven/trailing and restart behaviour before relying on unattended operation. The surviving signal should not erase the earlier incident from the review.
Historical research: in-sample and out-of-sample claims
The developer describes Darwinex real-tick research with 2020–2024 used for development and 2018–2020 plus 2024–July 2026 as validation. The gallery graph marks the later boxed region at approximately January 2025, so the narrative and chart do not establish identical exact cutover dates. Ask for exact dates/settings if reproducing the split.
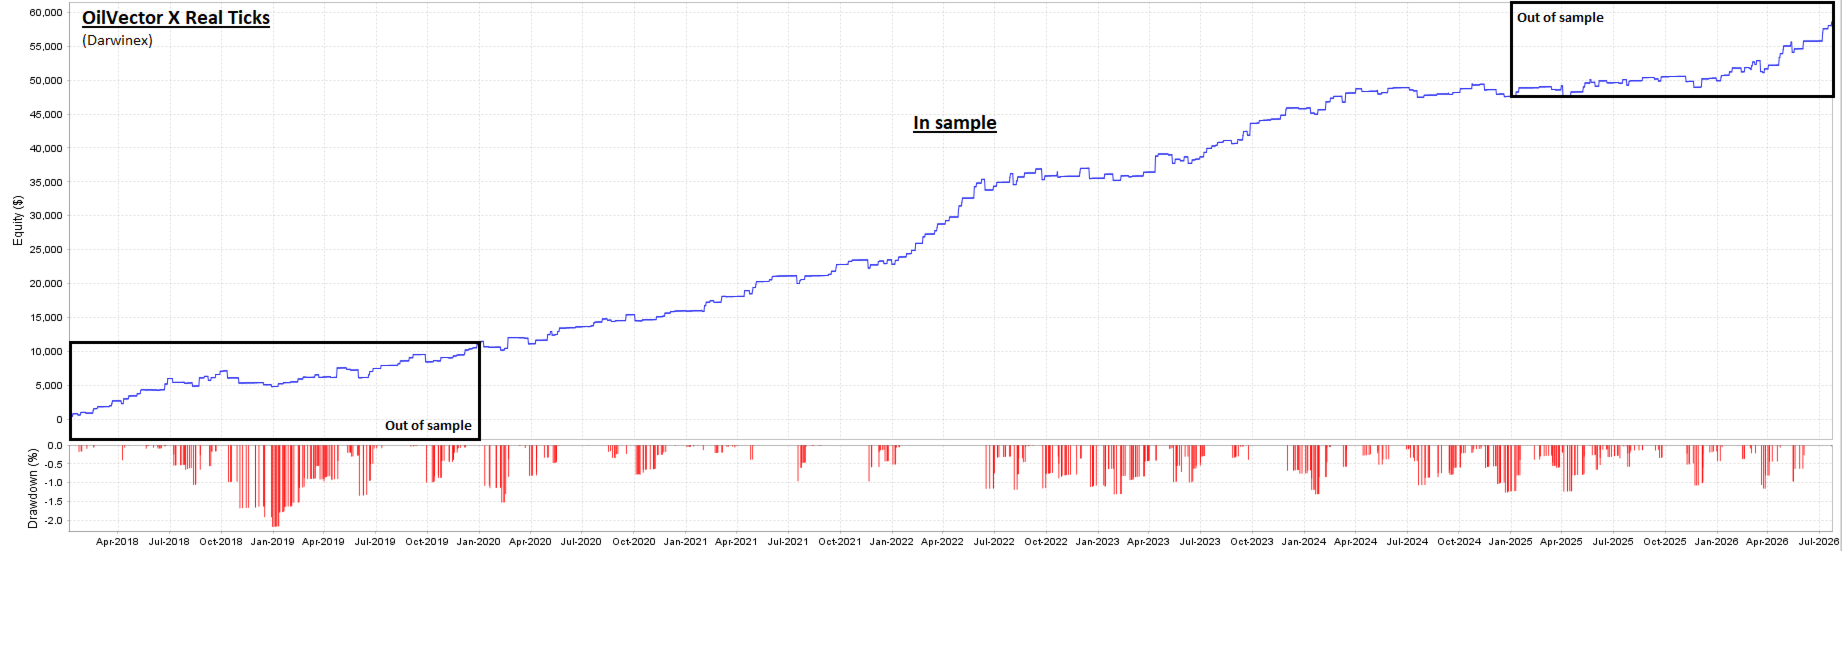
The curve rises over the long run but includes stagnation and setbacks. Out-of-sample labels are useful methodology disclosure; they do not independently establish that parameters were never revisited after viewing those periods. We have not reproduced the backtest.
Original report: win rate and loss size together
The statistical image reports 1,110 trades, profit factor 2.18, 87.48% winning trades, total profit 58,596.75 and drawdown 2.17% (2,327.22). It also shows average win 111.39 versus average loss 356.56, largest loss 1,619.31 and 200 days of stagnation. A high win rate must be read alongside the larger average loss.
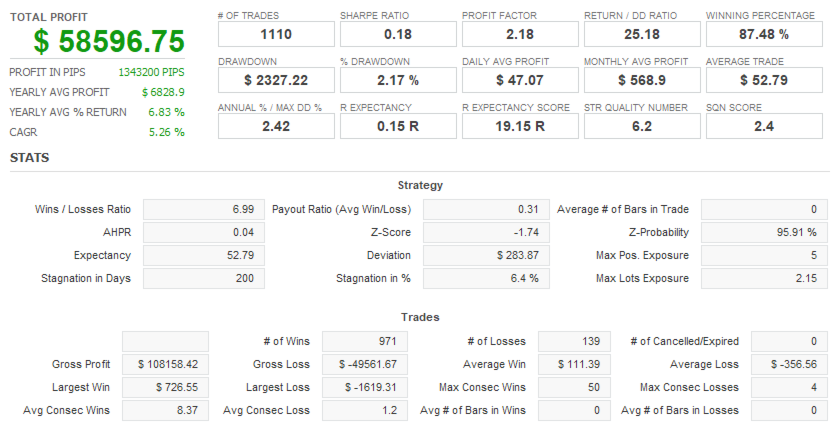
The report displays Sharpe 0.18 and a return/drawdown ratio 25.18. The developer’s text discusses broker-dependent recovery factors around 7 or higher on Darwinex; those statements are not automatically the same metric or same test configuration. Starting capital, sizing and all execution assumptions are not established by the image alone, so its 2.17% historical drawdown is not a live risk cap.
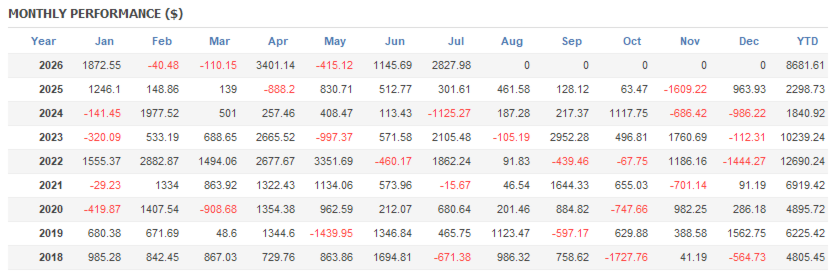
The monthly matrix includes losses, such as November 2025 at −1,609.22 and March 2019 at −1,439.95 in the report’s dollar display. The 2026 row stops producing results after July; later zero cells should not be counted as completed flat months. This backtest is materially different evidence from the short live signal.
XYZ Fund A is a portfolio, not a second OilVector record
The developer says XYZ Fund A runs eight EAs together. At the check, it showed 4.63% growth, 163 trades, profit factor 1.14 and a four-week account history; monitoring began 4 September 2026. Its balance drawdown was 11.86%, while the separately monitored equity series showed 4.09%. Those values cover different series and should not be collapsed into a single preferred risk number.
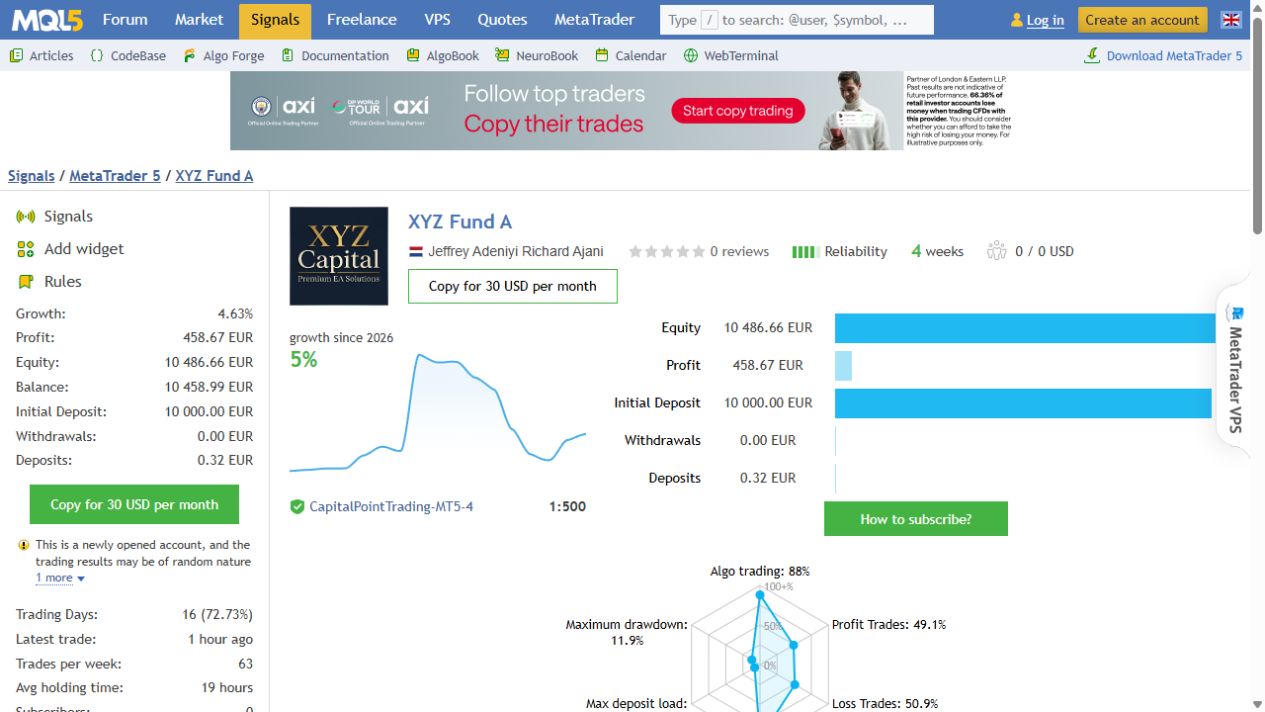
The account includes oil, indices, FX, gold and crypto. Its overall results cannot be attributed to OilVector X. MQL5 warns that the account is new and records that 80% of growth came within one day. It is useful portfolio context, not evidence that this EA alone produced the portfolio return.
Prop mode: controls, not automatic rule compliance
The listing describes a daily loss threshold that halts new entries, a total loss threshold measured from the EA starting balance, optional daily profit lock, randomized entry/stop/target offsets and a saved-state reset. It does not establish that every threshold forcibly liquidates open positions. Nor does it show that its reset time, floating-P/L treatment and starting-balance definition match every evaluation firm.
Entry randomization is a configuration feature, not permission to bypass a firm’s restrictions. Check the actual account rules and test limits, resets and existing-position handling. The phrase prop-firm-ready is the developer’s marketing description, not approval from a funding company.
Customer reviews and further material
No MQL5 customer reviews or substantive comments were available at our check, so there are no customer-review captures to present. Check current customer reviews · View developer comments. The setup manual is private, and no public release-note tab was exposed on the checked listing.
The listing also embeds Oil Vector X Part 2 Review — A More Accurate Test, by Prosperity Algo Solutions. We link it as further viewing; its conclusions have not been used as independently verified results in this assessment.