
Vex Gold EA MT5 Review: Signals, Backtests & Buyer Feedback
Vex Gold EA MT5 is a gold breakout system using pending entries, EMA bias and actively managed stops. Its main appeal is a single-position approach without grid or martingale, supported by two public MT5 records and a useful operational manual.
Our assessment: a promising option to investigate for selective gold trading. Execution sensitivity and the still-short forward records matter more than the very large simulated profits. The current evidence is encouraging, but does not establish long-term reliability.
View Vex Gold EA MT5 and pricing

Research and captures: 13 September 2026. We examined public material; we have not independently traded or reproduced the EA’s tests.
What the strategy actually does
Vex Gold follows gold breakouts through pending orders, using price structure and directional filtering. The manual describes risk profiles as sizing choices, so a higher profile does not create a different entry strategy. Stops and take profit are combined with active trailing; execution costs can therefore change the outcome of otherwise similar setups.
The developer’s July explanation clarifies why two accounts may not match immediately: a newly attached instance waits for a fresh setup instead of reconstructing an earlier pending order from another account. Differences in start time do not by themselves prove a fault.
BlackBull Markets: the longer public record
- Growth and trading profit
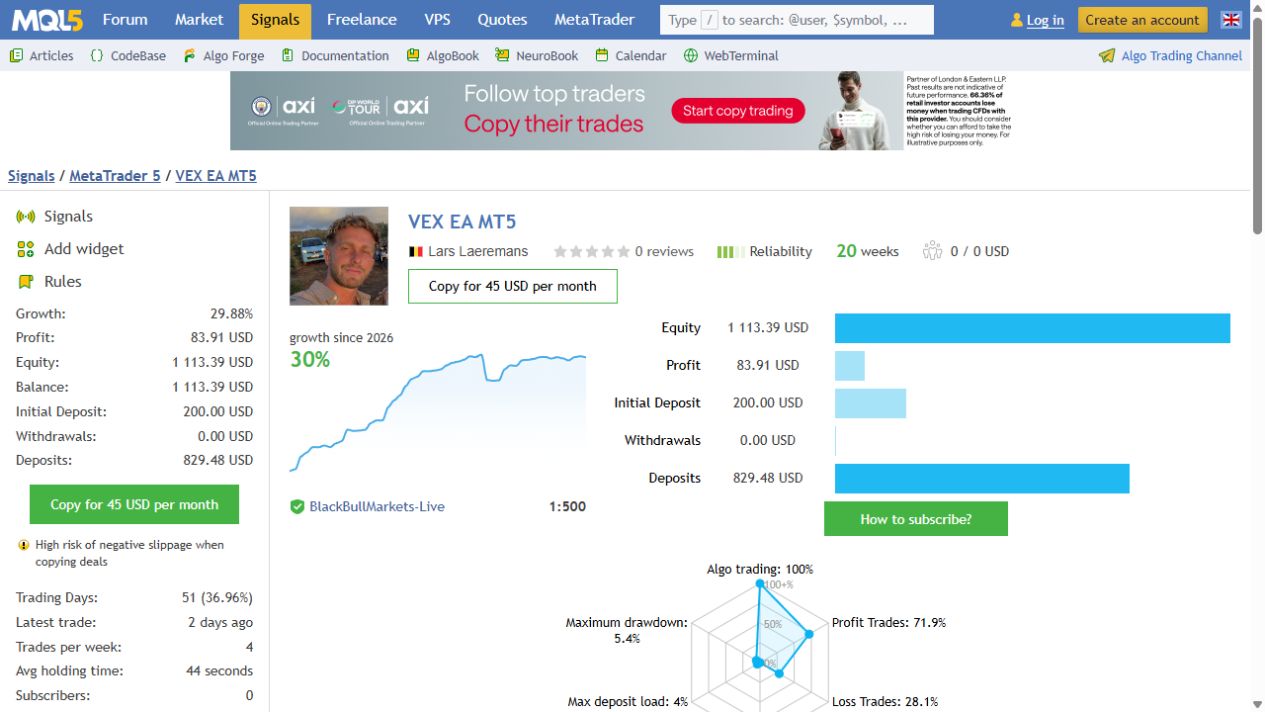
- 29.88% growth; $83.91 profit.
- Funding
- $200 initial deposit plus $829.48 additional deposits, no withdrawals; balance and equity $1,113.39.
- Sample
- 64 gold trades, 20 displayed weeks; signal started 7 June 2026. Earlier trading history is not the same as forward monitoring since inception.
- Trade profile
- Profit factor 1.85; 71.87% winners; average holding time 44 seconds.
- Drawdown
- Relative equity 4.81%, relative balance 5.39%. MQL5 also reports maximal balance drawdown of $60.70 (20.84%); preserve that separate measure when reading the headline.
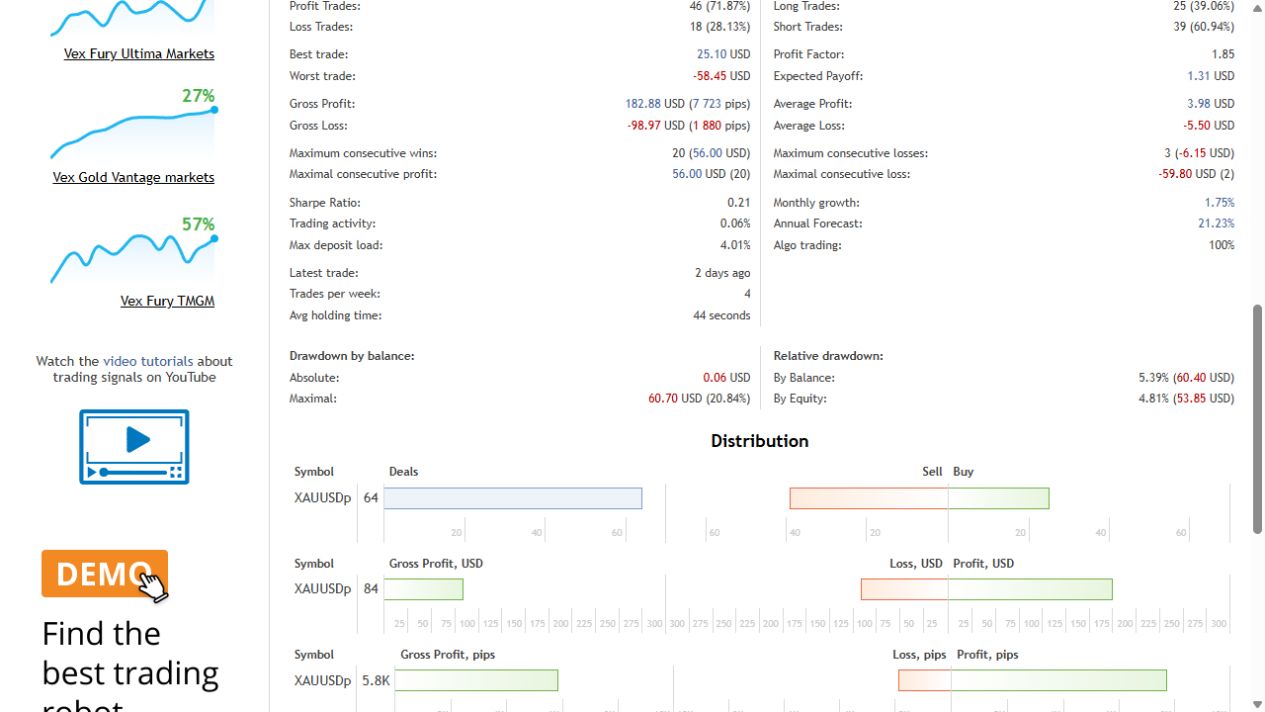
The developer openly explained the extra funding in July. The larger balance is mostly contributed capital, not profit earned from the original $200. July also shows a negative growth month, so the record is not an uninterrupted winning sequence.
Inspect the current BlackBull Vex signal
Vantage: encouraging, but much newer
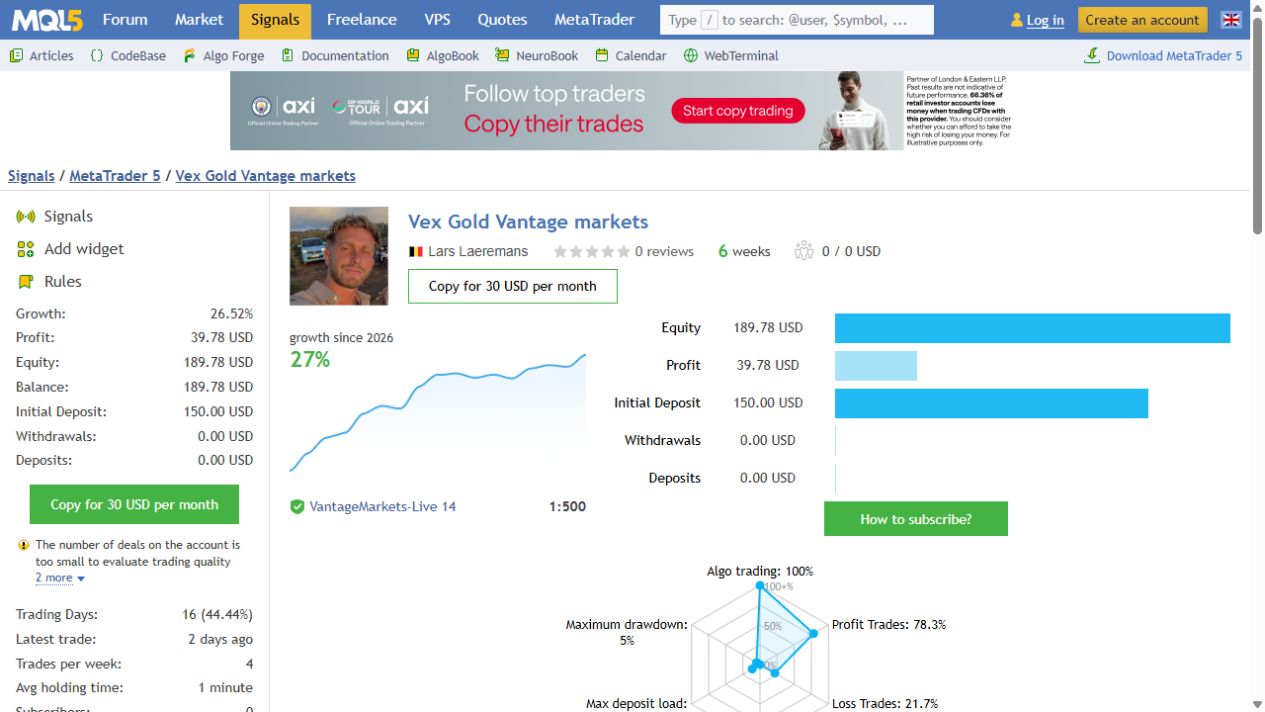
The VantageMarkets-Live 14 account showed 26.52% growth and $39.78 profit on a $150 initial deposit, with no additional funding or withdrawals. Balance and equity were $189.78. Its 23 trades produced a 6.72 profit factor; relative equity drawdown was 4.95%, versus 1.33% by balance.
The signal started on 11 August 2026 and displayed six weeks of history. That is a small sample: MQL5 explicitly warns that there are too few deals to judge trading quality. Both accounts use 1:500 leverage and carry copying-slippage warnings. Signal-subscription fees are separate from buying the EA.
These accounts are not a controlled comparison with matching capital, dates and verified identical settings. Their positive results support further investigation, not a promise that a third account will match them.
Inspect the current Vantage Vex signal
Original backtests: look past the large profit numbers
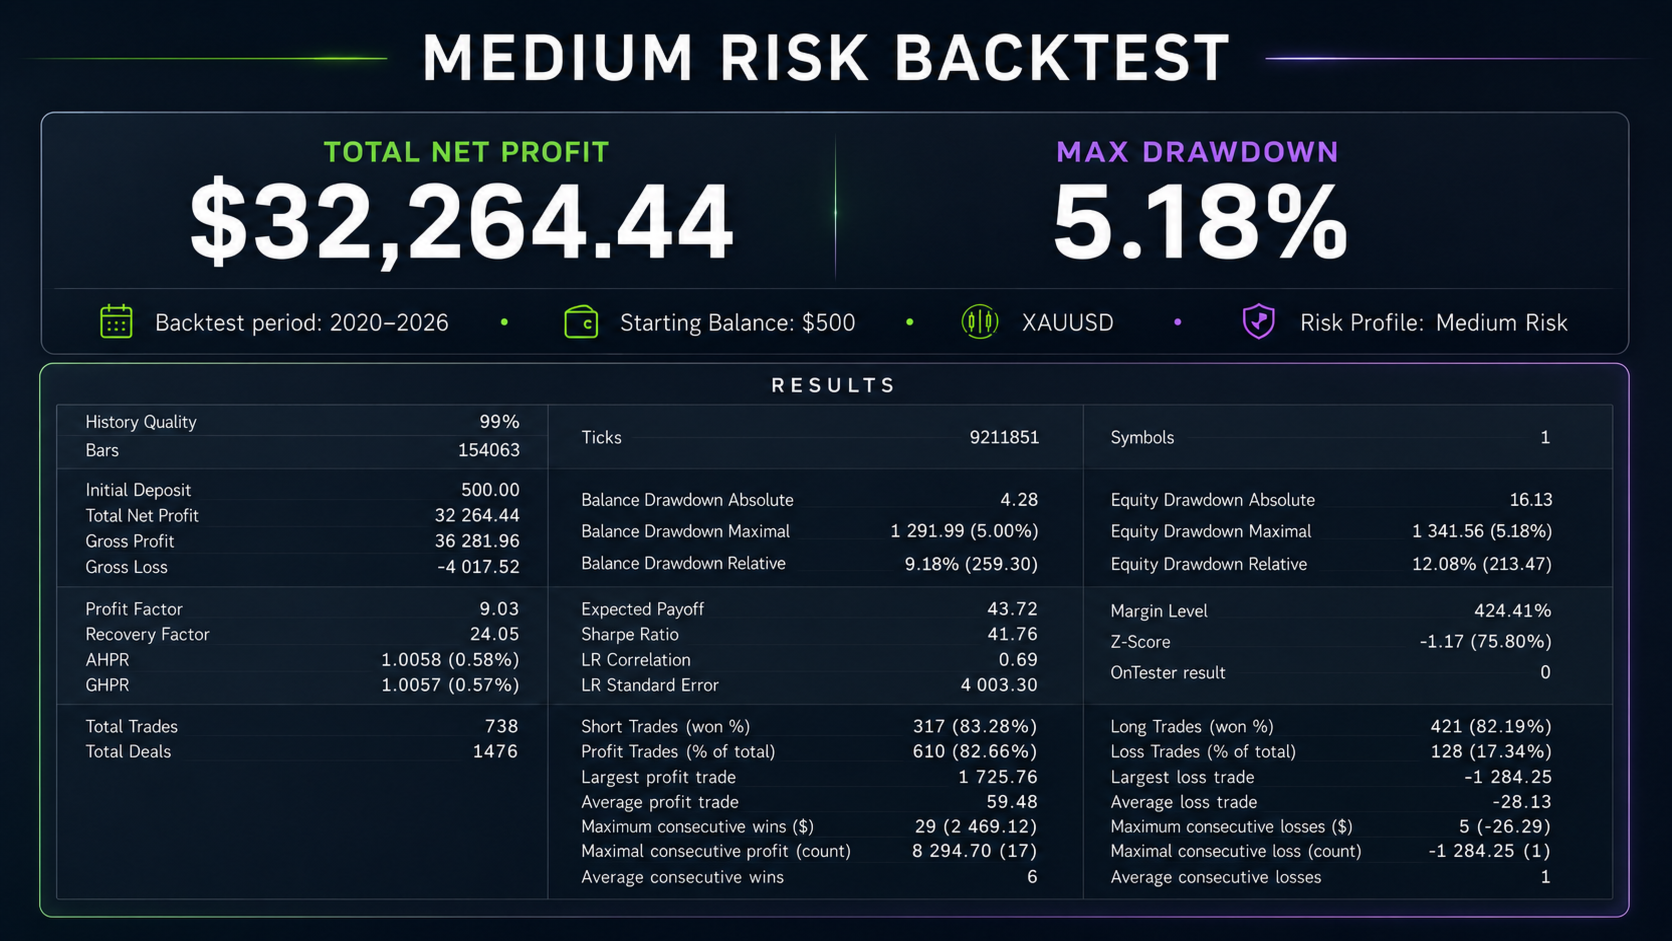
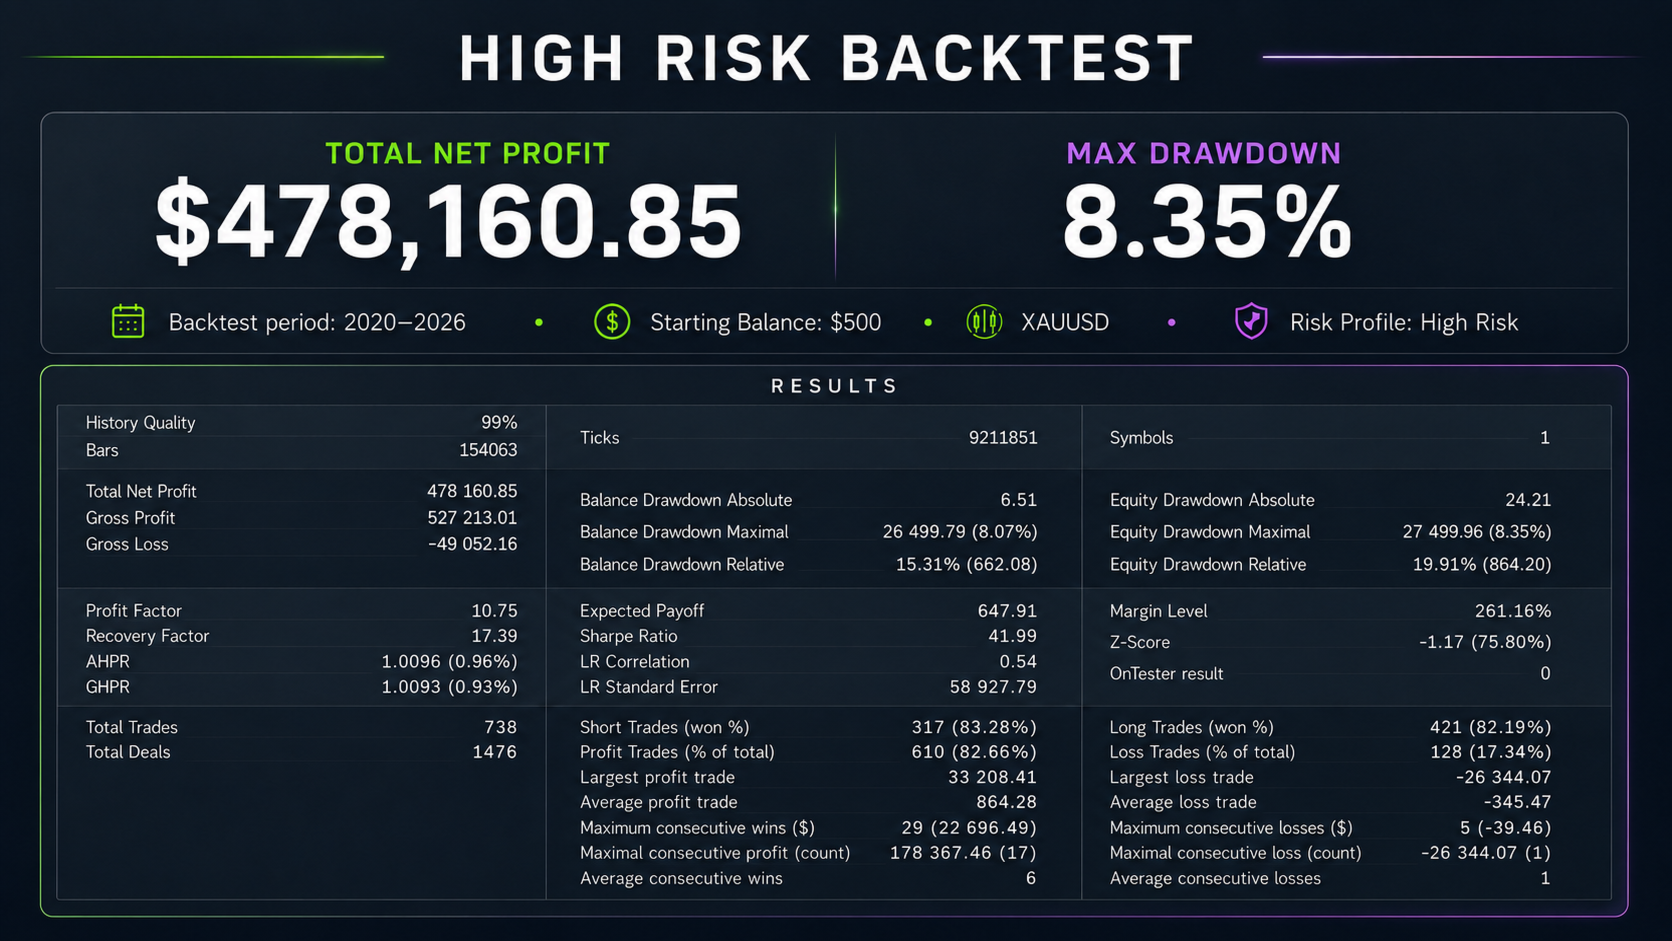
The gallery includes two 2020–2026 tests starting at $500. The medium-risk report shows $32,264.44 net profit and the high-risk report $478,160.85. Those are historical simulations with different sizing, not realistic income targets for a new customer.
The drawdown labels need care. The medium-risk headline is 5.18%, while its detailed relative equity drawdown is 12.08%. In the high-risk test those figures are 8.35% and 19.91%. They describe different measurements; presenting only the smaller headline would leave out useful risk context.
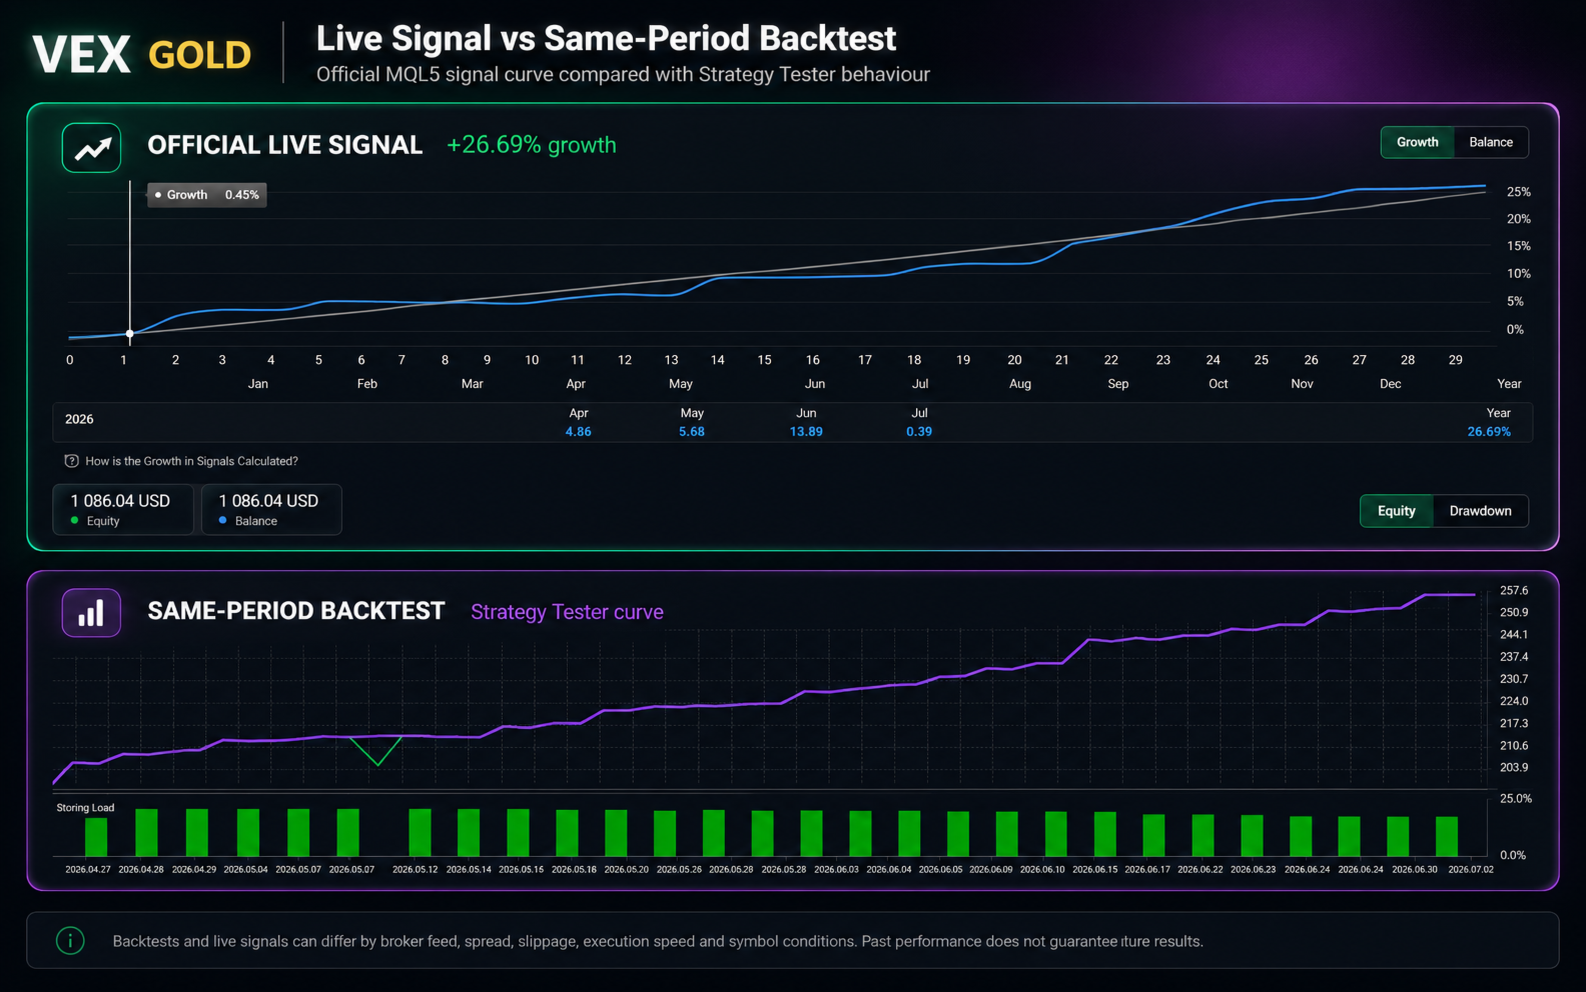
Historical live-versus-test comparison
Medium-risk test report
High-risk test report
Earlier seven-week signal image
Earlier 726-trade tester report
Historical balance and equity curve
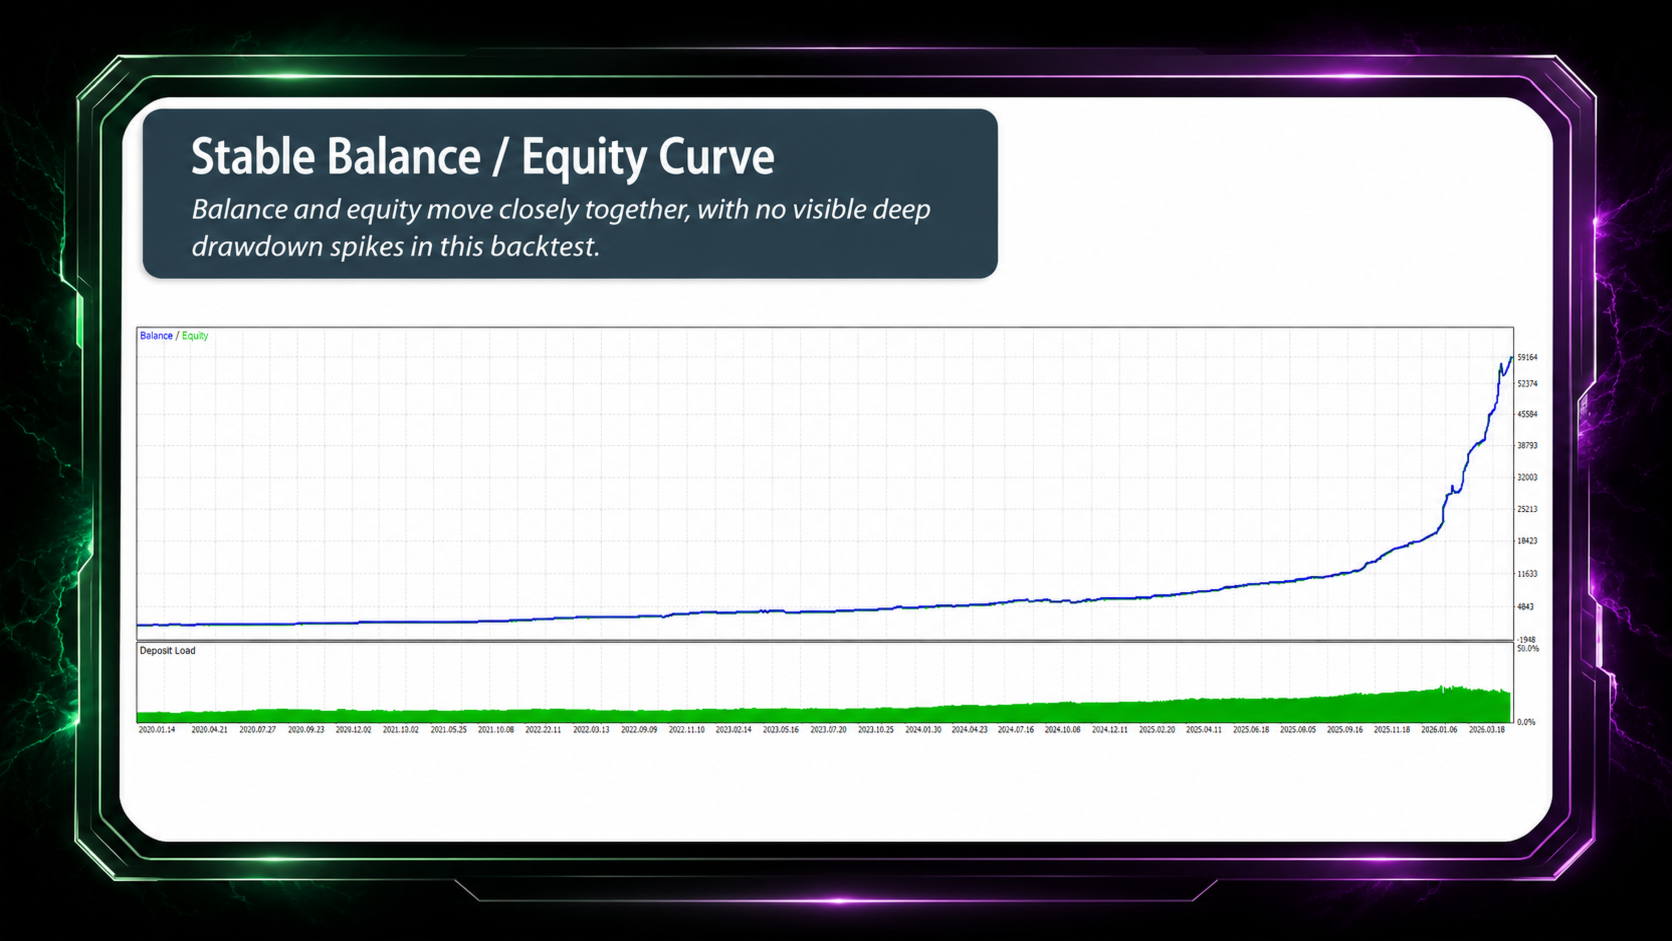
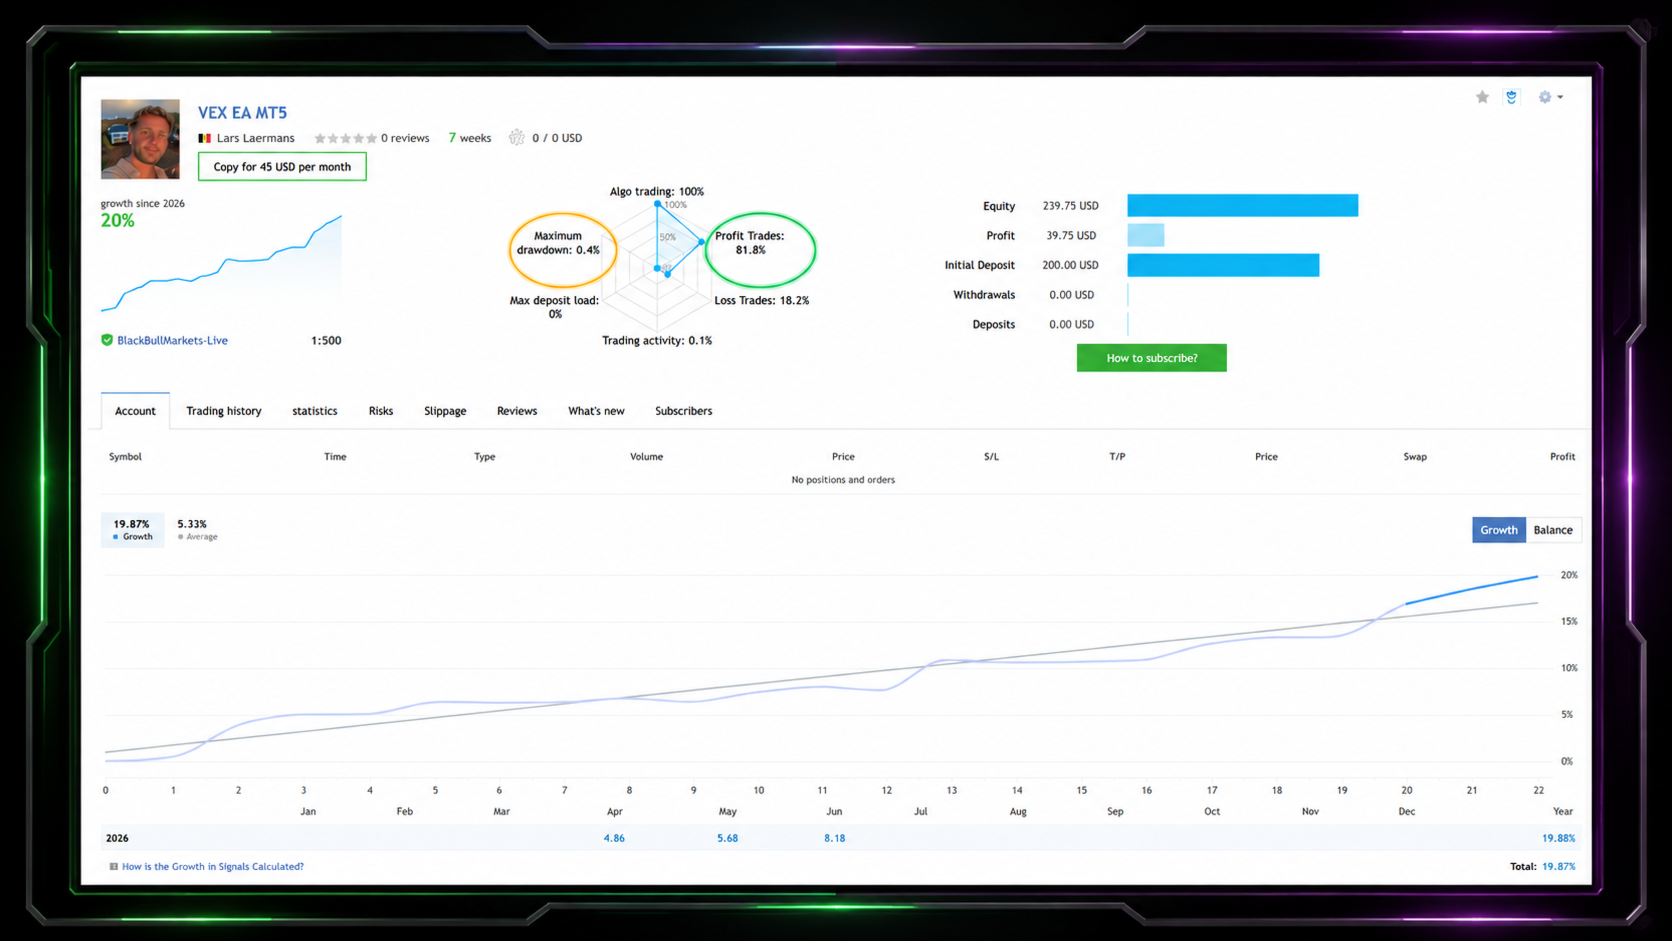
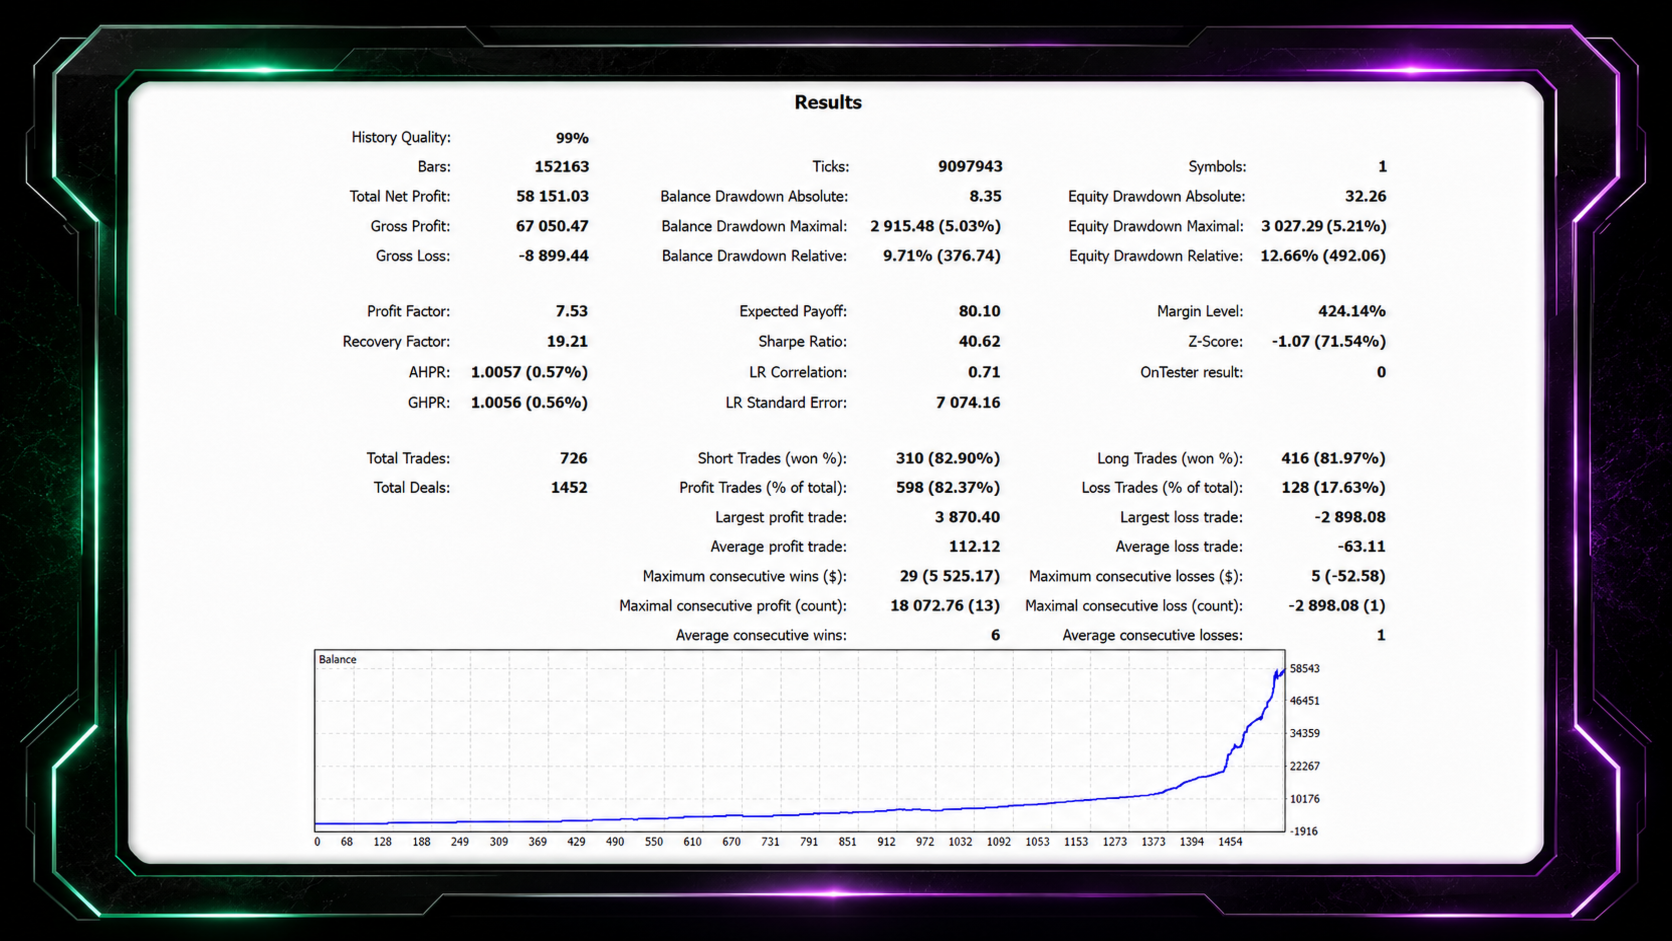
The older 726-trade report and later 738-trade reports should not be merged into a single test. We have retained the original images so readers can inspect the differences. The live-versus-test composite is the developer’s selected historical comparison; we have not reproduced it independently.
The developer’s article on overfitting makes a useful broader point: compare forward behaviour, holding times and drawdown with the test, and examine sensitivity to settings. The public screenshots alone do not establish a robust out-of-sample validation process.
Risk profiles, minimum volume and broker conditions
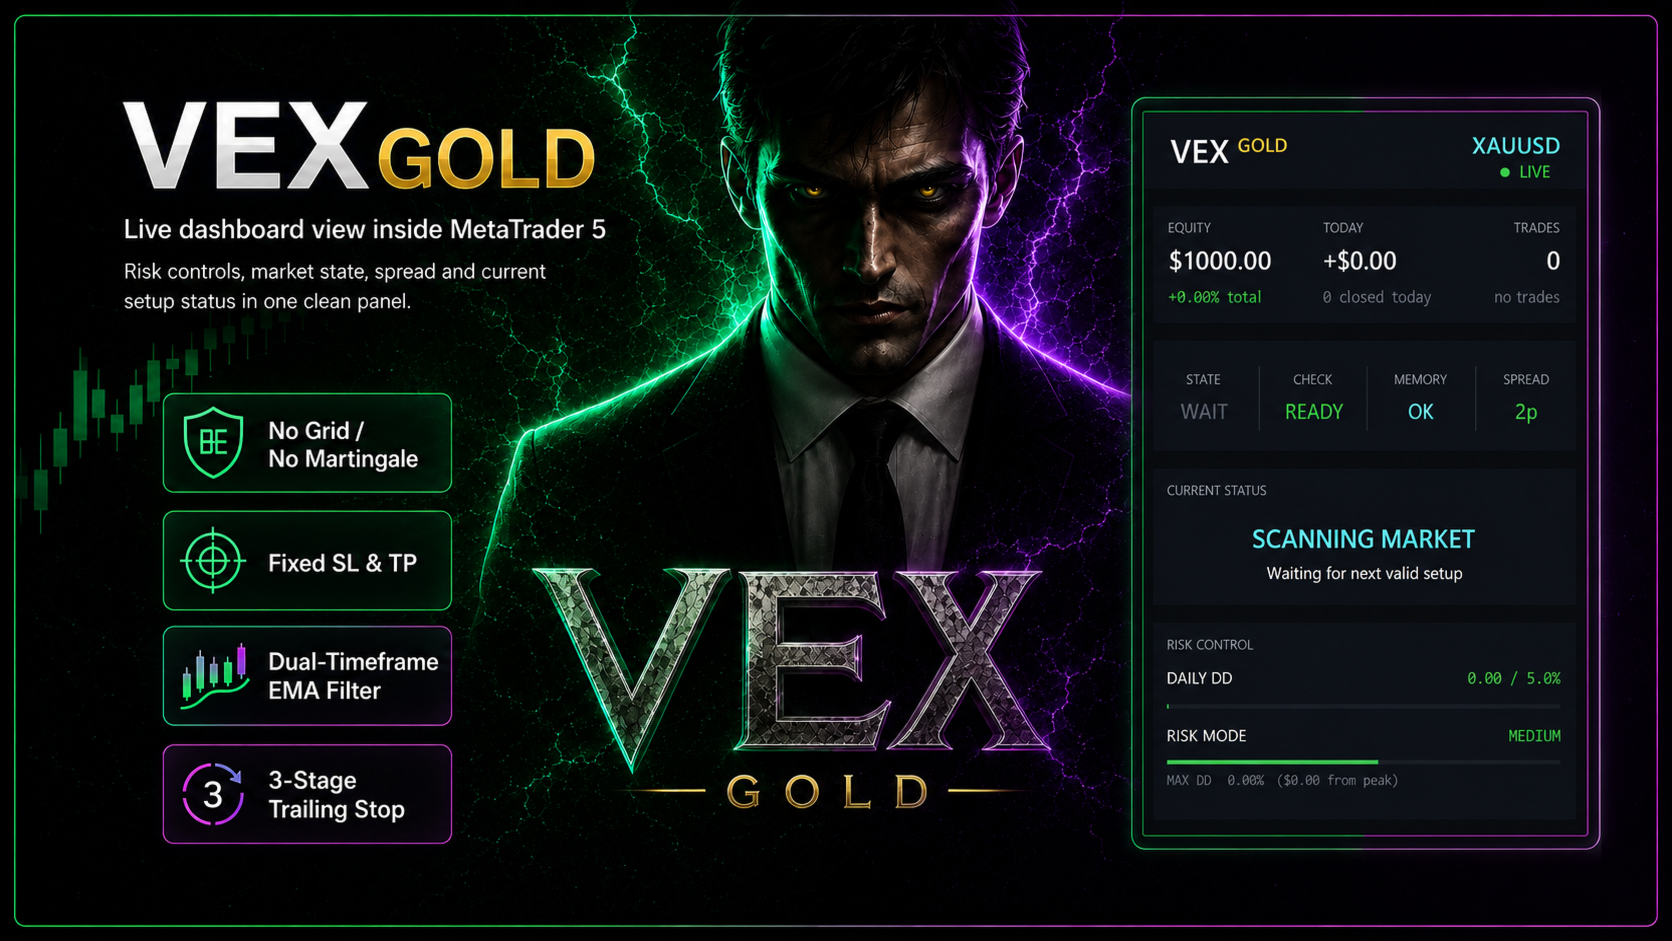
The manual provides fixed-lot and automatic sizing, a maximum-lot cap and a startup preview. A small balance can be constrained by the broker’s minimum trade size. In July, the author described Low Risk as targeting 2% per trade, while explaining that the minimum 0.01 lot can exceed that intended percentage on smaller accounts.
This makes the advertised $200 minimum a technical starting point rather than proof that the risk profile can be implemented precisely. Gold contract specifications, spread, commission, stop restrictions and fill quality all deserve checking. Avoid multiple instances sharing the same symbol and magic number.
The public guide says normal operation does not require a WebRequest URL. Its VPS_SPEED option switches off visuals rather than changing the trading strategy. A connected terminal is still needed for active management.
What Prop Firm Mode can and cannot do
Version 2.0 introduced a separate risk setup, daily-equity budget, reset hour and safety buffer. It estimates stop-loss risk before allowing a pending entry and cancels Vex-owned pending orders when the budget blocks further trading.
It does not force-close existing positions. Slippage and other account activity can still affect equity, so the mode is not a guarantee of staying within a provider’s rules. Standard mode remains a separate configuration; its daily guard is scoped to the EA’s symbol and magic number.
Buyer reviews and practical feedback

The listing showed 13 ratings and a five-star aggregate when checked. Buyers repeatedly praise the developer’s responsiveness and report positive early experiences. The short excerpt above illustrates that sentiment; it is not a risk assessment we have verified.
Several accounts of success cover only days or a few weeks. One August reviewer explicitly describes a Fusion Markets demo account before moving to real money. Another buyer calls the EA highly broker-sensitive. In the comments, a July customer reports a full stop-loss on the first live trade, a useful counterpoint to the winning-trade screenshots.
We keep these third-party opinions separate from CheaperForex verified-purchase ratings. The ratings should complement the public trade history, not override it.
Current release context
The inspected release was 2.12, dated 4 August 2026, addressing a download-compatibility issue on older terminals. Version 2.10 added three-decimal gold support and optional adverse-fill stop adjustment, disabled by default. Version 2.0 added Prop Firm Mode while retaining the core entry logic.
Older manuals and dashboard images can therefore omit newer controls. Review the current inputs after updating rather than assuming a historical screenshot is a complete settings guide.
Verdict
Vex Gold offers an understandable gold strategy, explicit exits and useful public evidence. Both linked accounts were profitable at the review date, and the developer discusses funding and broker differences openly. The sensible next step is to evaluate matching conditions and conservative sizing; short records and exceptional backtests do not establish years of dependable returns.
View Vex Gold EA MT5 and pricing
Frequently asked questions
Why might two Vex accounts show different pending orders?
The developer explains that pending orders are created when a fresh setup appears. Attaching another instance later does not recreate an earlier account’s order; market structure and EMA direction may already differ.
Are the two public signals a controlled broker comparison?
No. Their histories, balances and funding differ, and identical settings throughout were not established. They are useful separate records, not proof that one broker will reproduce the other.
Does the backtest’s headline drawdown show every risk measure?
No. The medium-risk image lists 5.18% maximal equity drawdown and 12.08% relative equity drawdown. The high-risk image lists 8.35% and 19.91% respectively. Read the full report and compare like-for-like measures.
Are MQL5 customer ratings verified CheaperForex reviews?
No. They are third-party buyer opinions shown with attribution. They have not been imported as CheaperForex purchase ratings or independently verified performance.
Official listing and buyer reviews · Public manual · Release notes · Developer comments