
Imperial Dominator Review: 1267% Signal Growth, Drawdown & Educational Purpose
Imperial Dominator EA MT5 combines a time-box breakout with split batch entries and profit-assisted closing of older positions. Its real distinction is educational: the developer deliberately exposes mechanisms that can make backtests and winning streaks look more convincing than the underlying strategy.
View Imperial Dominator MT5 features and pricing

- Developer source link: Imperial Dominator on MQL5
- Live signal link: Imperial Dominator experimental account
- Developer explanation: POM Education Series: The Illusion of a Perfect EA
What the live signal actually shows
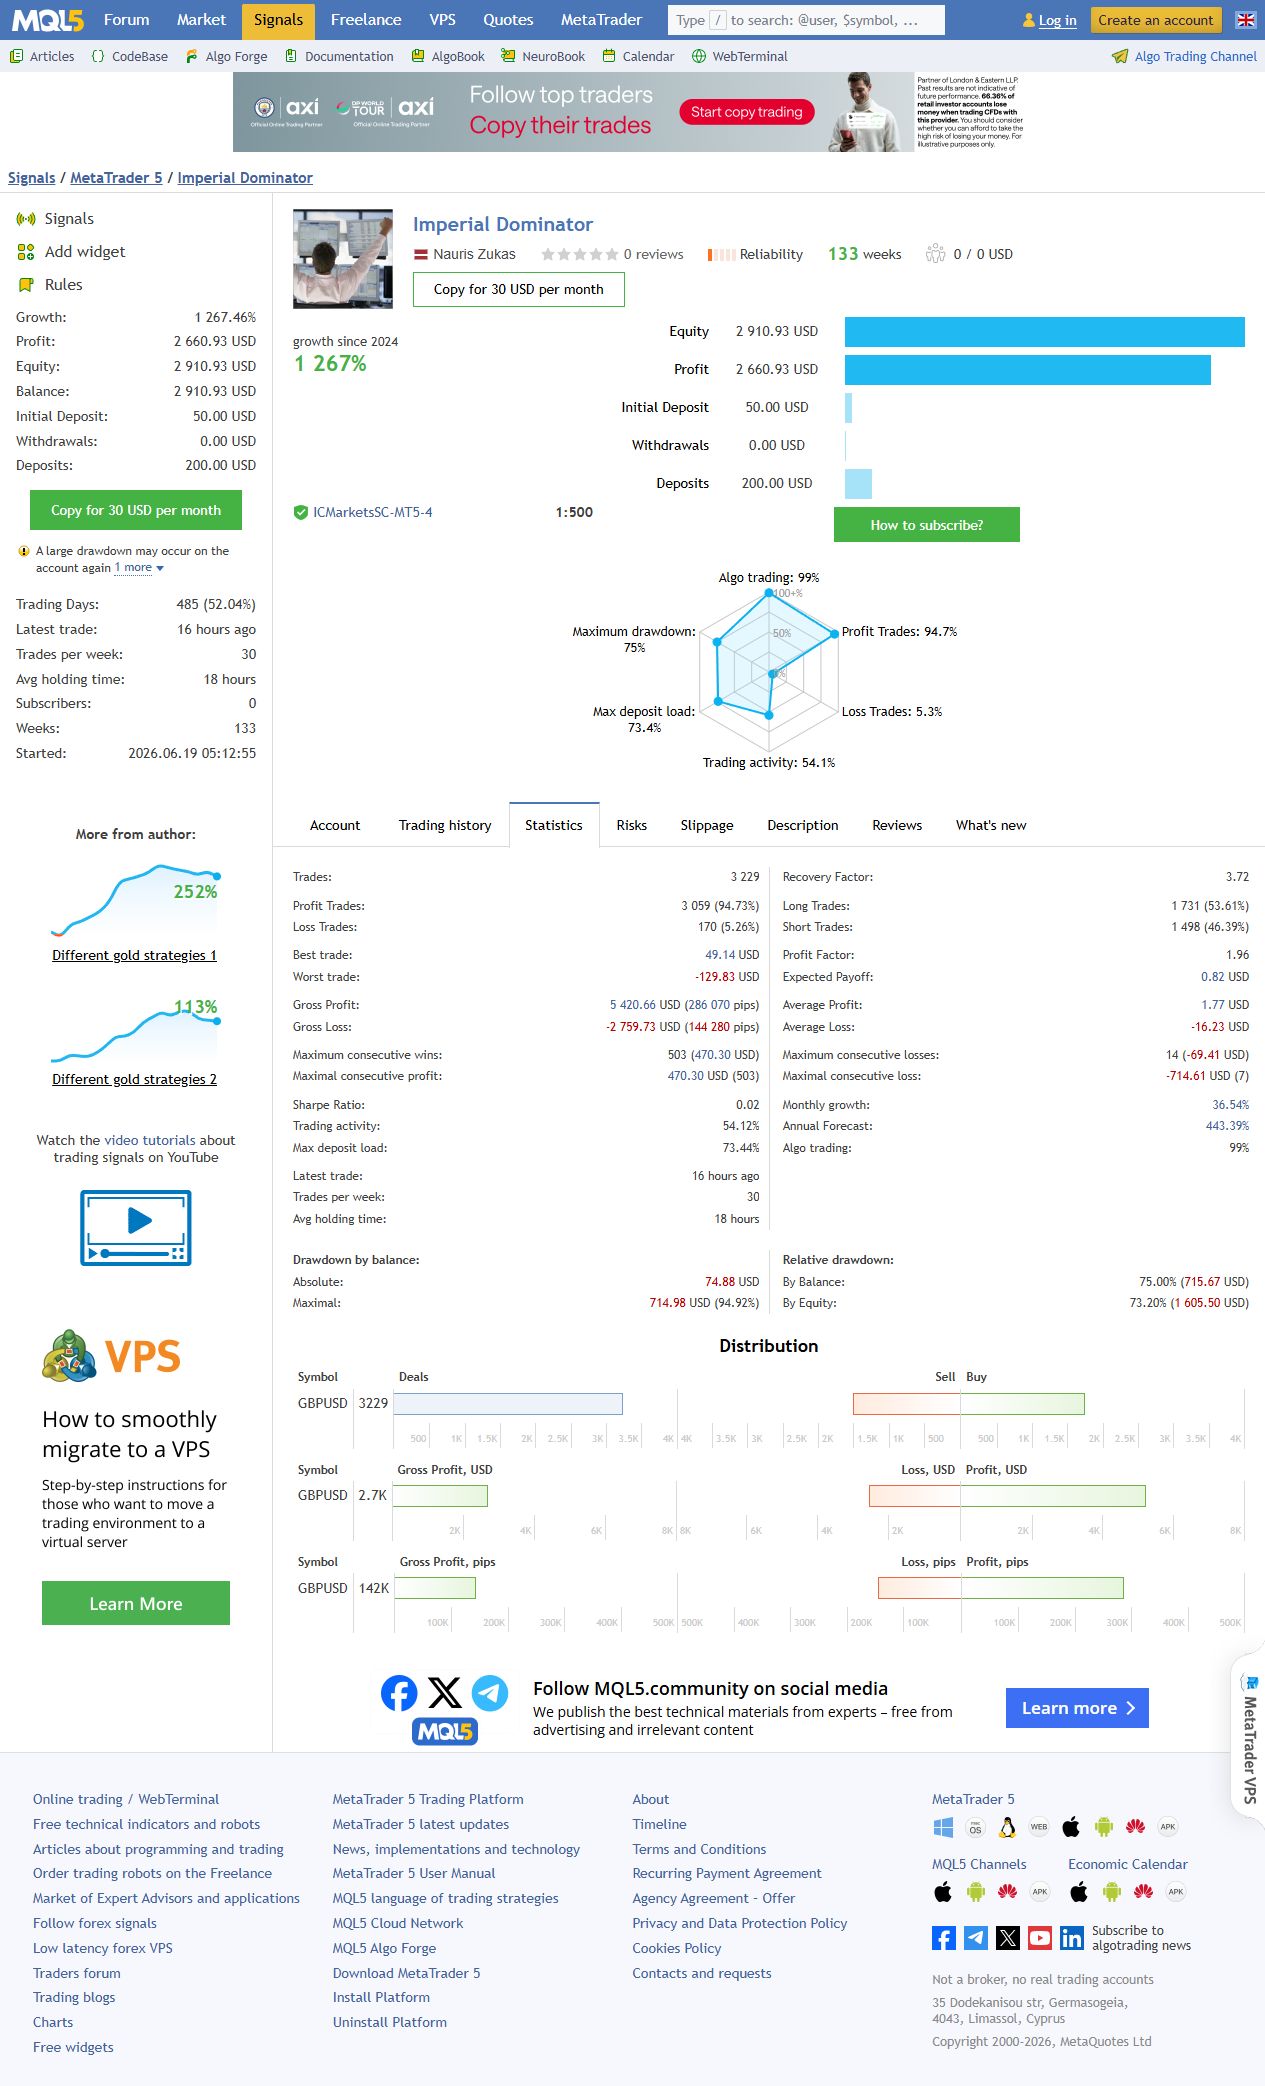
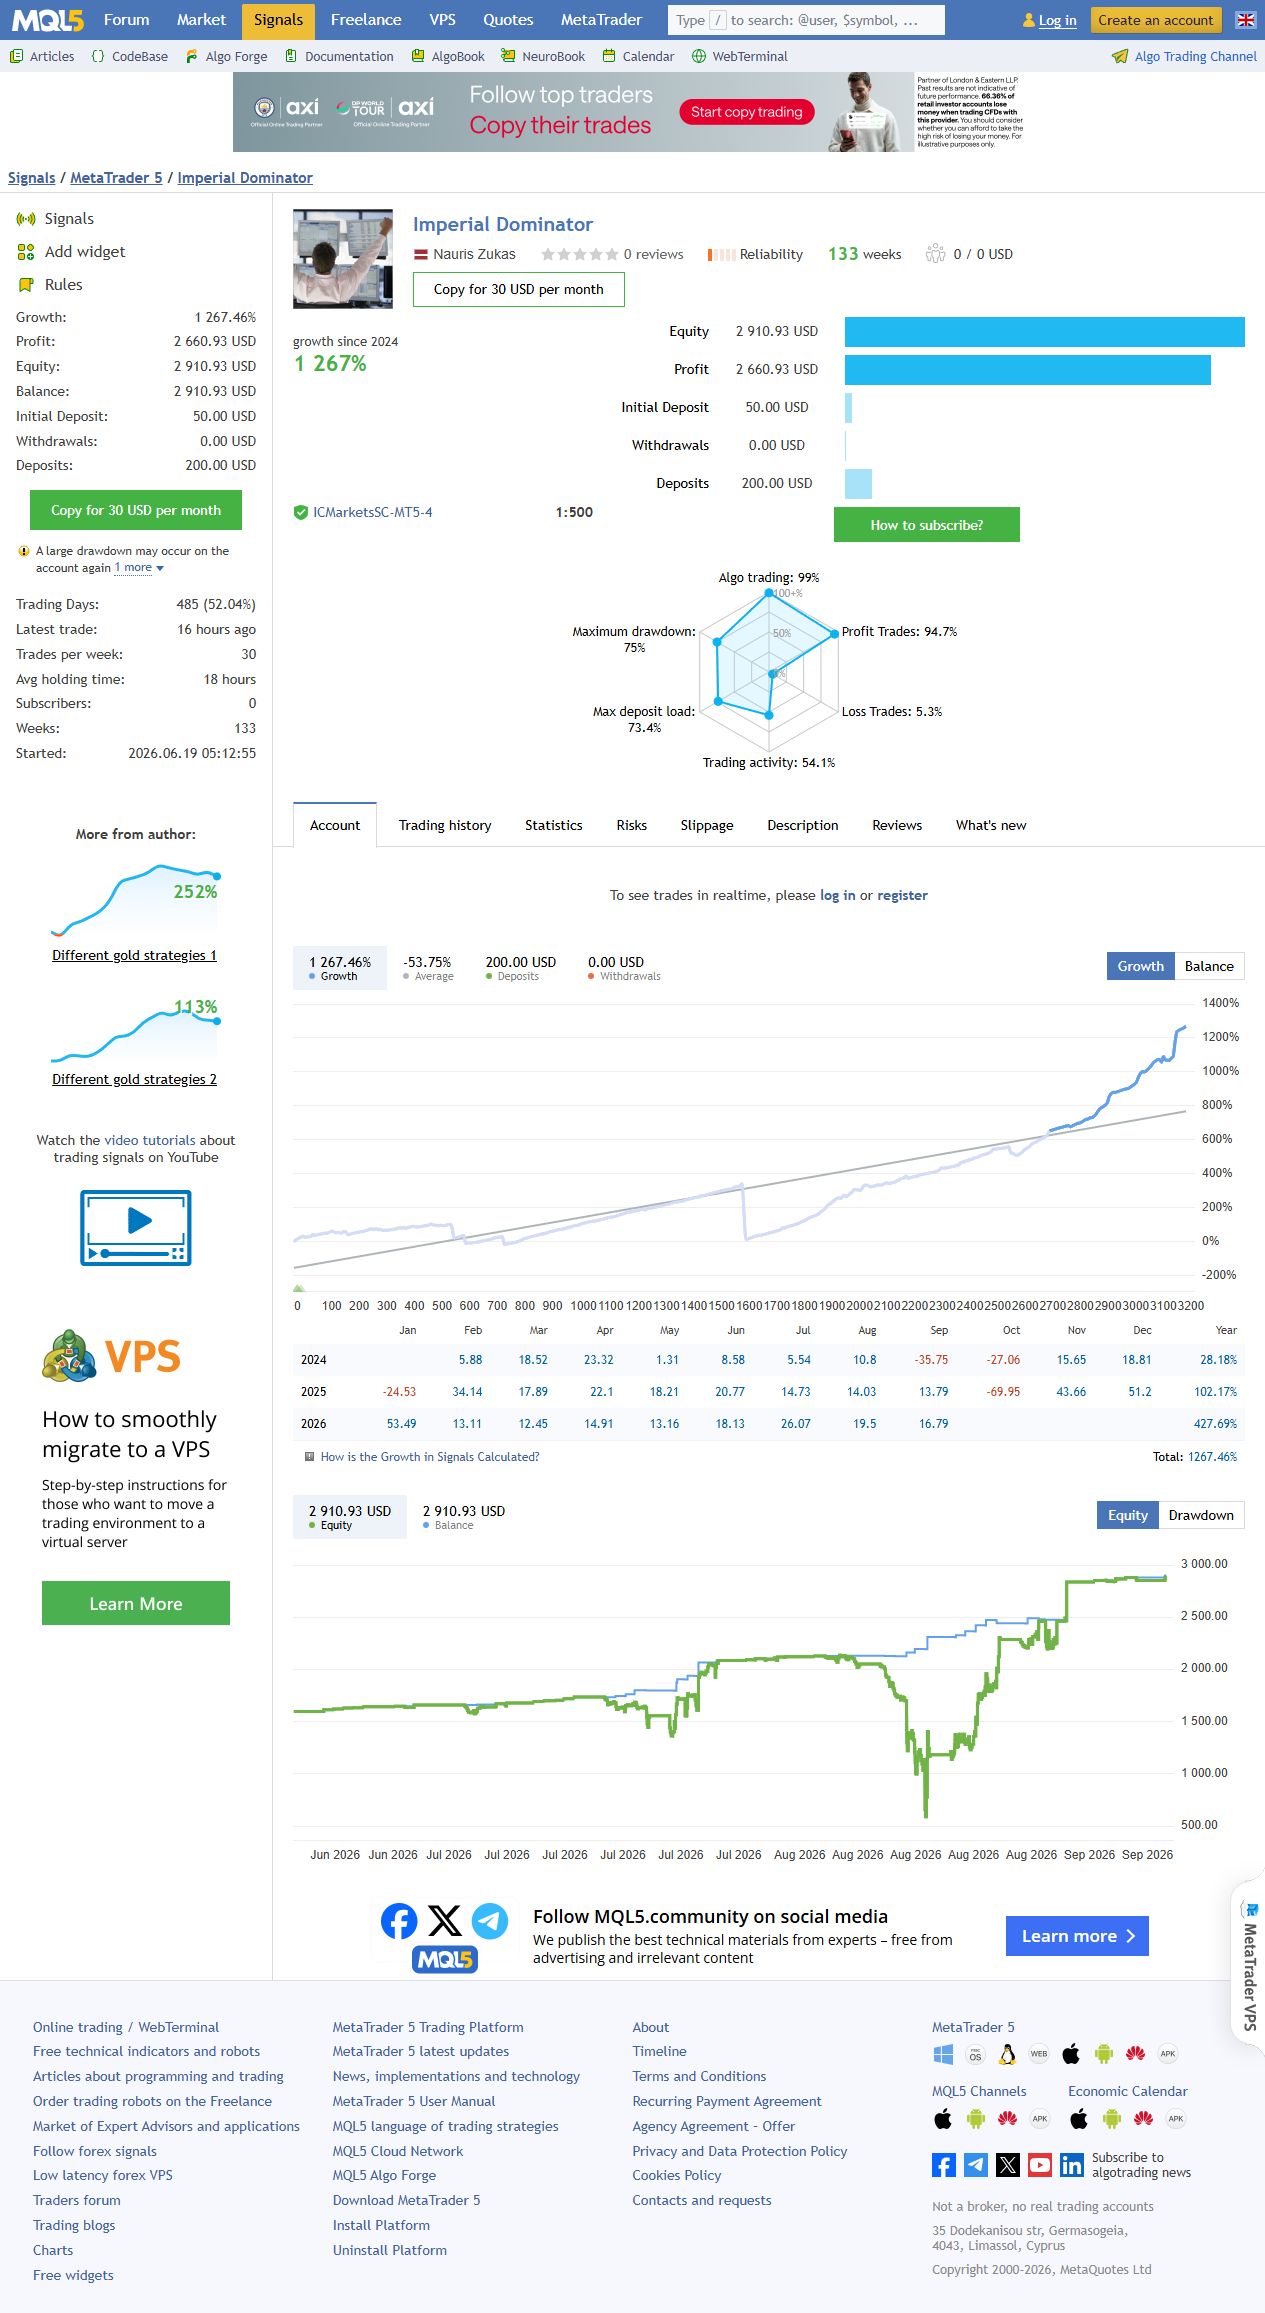
At our 15 September 2026 check, MQL5 reported 1,267.46% growth, $2,660.93 profit and $2,910.93 balance/equity. It lists an initial deposit of $50, later deposits of $200 and no withdrawals. The percentage is MQL5’s growth metric; it should not be confused with dollar profit or a simple return calculated from the initial deposit alone.
The account is labelled real on ICMarketsSC-MT5-4, with 1:500 leverage. That gives identifiable broker/account context, but a recognisable broker does not validate the strategy’s edge or eliminate its trading risk.
Drawdown changes the interpretation
The statistics show 73.20% relative equity drawdown and 75.00% relative balance drawdown. October 2025 recorded minus 69.95% growth. MQL5 also displays a warning that a large drawdown may occur again. These figures belong alongside the positive headline, rather than being hidden below a claim of smooth or safe returns.
The source presents several drawdown calculations, which are not interchangeable. Our figures above use its explicitly labelled relative equity and relative balance measures. Its separate maximal balance-drawdown row shows another amount/percentage calculation. A current flat account or zero current floating drawdown does not erase those historical losses.
Account age and monitoring age are different
MQL5 displays 133 weeks of account history, with results reaching back to 2024, but its Started field is 19 June 2026. The product was published on 8 September 2026. The displayed history therefore predates both the public product and the signal’s stated monitoring start. It should not be described as 133 weeks of independently observed performance of today’s retail file.
Recovery Booster is part of this experiment
In his explanation, Nauris Zukas says Recovery Booster is also used on the Imperial Dominator account to explore how long the system can be kept operating. He warns that the recovery mechanism can worsen drawdown when losses occur consecutively. The account result is therefore not evidence for Imperial Dominator operating alone, and buying this file should not imply that every tool or account setting used in the signal is included.
How the core strategy works
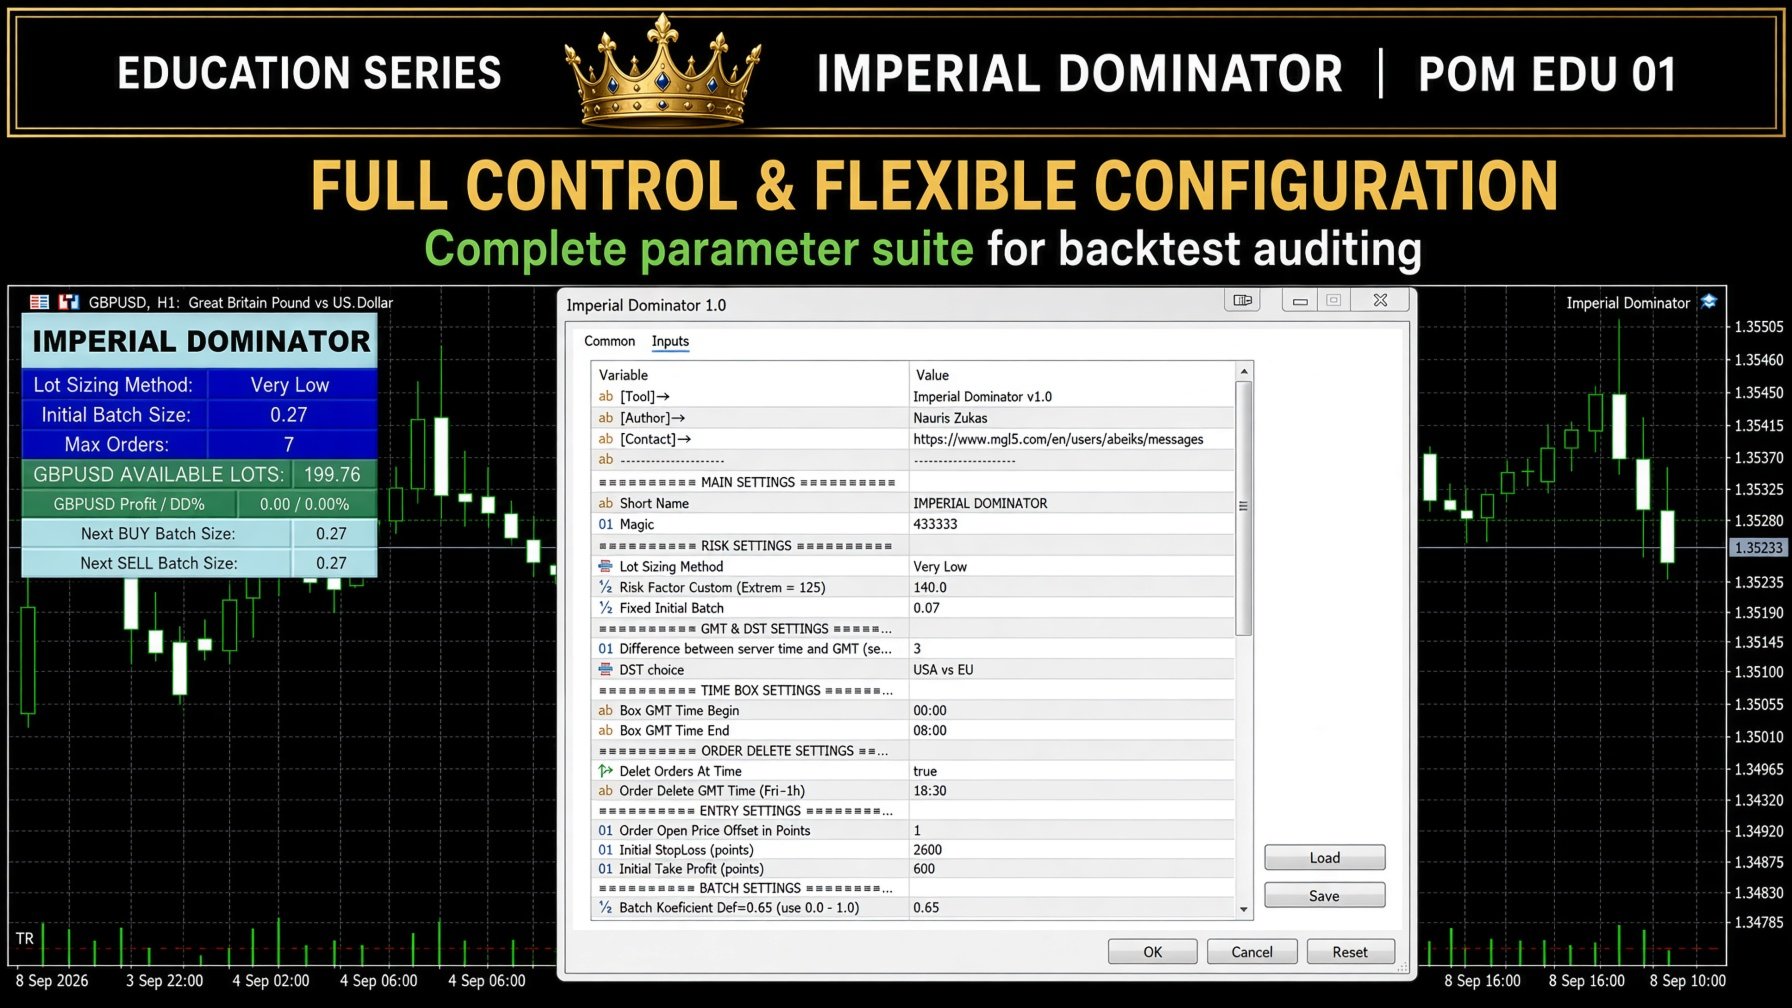
The developer’s worked example forms a daily range from eight hours of price history, then sets Buy Stop and Sell Stop orders around the high and low. An entry is split into seven equal orders in that example. The available inputs let users change range times, offsets, stop and target distances, order count and sizing.
Splitting one entry creates several rows in the history without creating several independent trading decisions. Likewise, the batch coefficient uses part of closed profit to offset losses on remaining positions. These mechanisms change how the history looks and how losses are realised; they do not make exposure disappear.
Why the high win rate needs context
The captured account has 3,229 trades and a 94.73% profitable-trade rate, but its average win is $1.77 against an average loss of $16.23. Profit factor is 1.96. The developer’s educational article demonstrates how small realised winners and much larger possible losses can coexist with impressive winning streaks.
The account has made money over the displayed period. That fact and the developer’s critique can both be true: profitability to date does not establish that the next large loss is controlled, that the result is repeatable, or that split trade counts measure independent opportunities.

Skip Days and historical selection
Imperial Dominator includes explicit date exclusions and a report of significant loss days. The developer uses these to demonstrate how excluding already-known losing dates can transform the same backtest. A polished historical curve built this way is not a forward prediction.
A useful educational comparison keeps the period, data and settings fixed while examining complete history against selected exclusions. Then consider what could have justified a filter before the excluded loss happened. Avoid treating hindsight-based date selection as evidence of a robust rule.

Documentation, customer feedback and suitability
The linked POM article is the main public explanation. No customer reviews were available on the product listing when checked, so there are no customer-review screenshots or independently tested user experiences to quote. The original gallery images are educational illustrations, clearly separated here from genuine signal captures.
The source also advertises free access for qualifying purchasers of the developer’s previous EAs. That is the developer’s own offer; eligibility and fulfilment must be checked with him and should not be assumed to apply to a CheaperForex purchase.

Read the full developer explanation and the current experimental signal before deciding whether the educational tool fits your needs. The developer says he does not recommend this signal for real trading. Our review has not independently tested the executable, and the supplied file does not guarantee replication of the account.
Also from Nauris Zukas: Undefeated Triangle MT4 is another product available on CheaperForex. It is a separate strategy and platform edition; its results should not be attributed to Imperial Dominator.