
Pro Multi FX MT5 Review: Four-Pair Forex Trend & Pullback EA
Pro Multi FX combines moving-average trend direction with RSI pullback entries across EURUSD, GBPUSD, USDJPY and AUDUSD from one MT5 chart.
Our assessment: A more conventional alternative to this author’s progressive grid systems: four-pair trend/pullback entries with explicit per-position exits. It suits buyers who want to inspect portfolio risk rather than rely on a recovery basket.
View Pro Multi FX MT5 features and pricing

- Developer source link: Pro Multi FX on MQL5
- Live signal link: no product-specific public signal linked at our 17 September 2026 check.
Trend direction first, pullback second
Fast and slow EMAs identify the broad direction, while RSI is used to time a pullback rather than enter every price move. This separates directional bias from entry timing. In choppy markets, that same process can still encounter repeated false continuation signals; an indicator combination alone is not evidence of an edge.
ATR exits and percentage sizing
The developer describes a stop loss and take profit on each position, scaled to current ATR volatility. Position size is calculated from balance risk and stop distance, with an adjustable reward-to-risk relationship. A wider volatility stop should therefore change the lot calculation rather than be treated as the same exposure at a fixed lot size. Optional ATR trailing changes how profitable trades are managed.
Four pairs are not four independent risks
EURUSD, GBPUSD, USDJPY and AUDUSD all contain the US dollar. A strong dollar move or scheduled announcement can influence multiple positions at once. Maximum concurrent trades and the daily loss circuit breaker are relevant portfolio controls, but they should be evaluated together with per-trade risk. The described daily breaker halts new trades for the rest of the day; the listing does not establish that it automatically liquidates all existing positions.
Dashboard and evidence
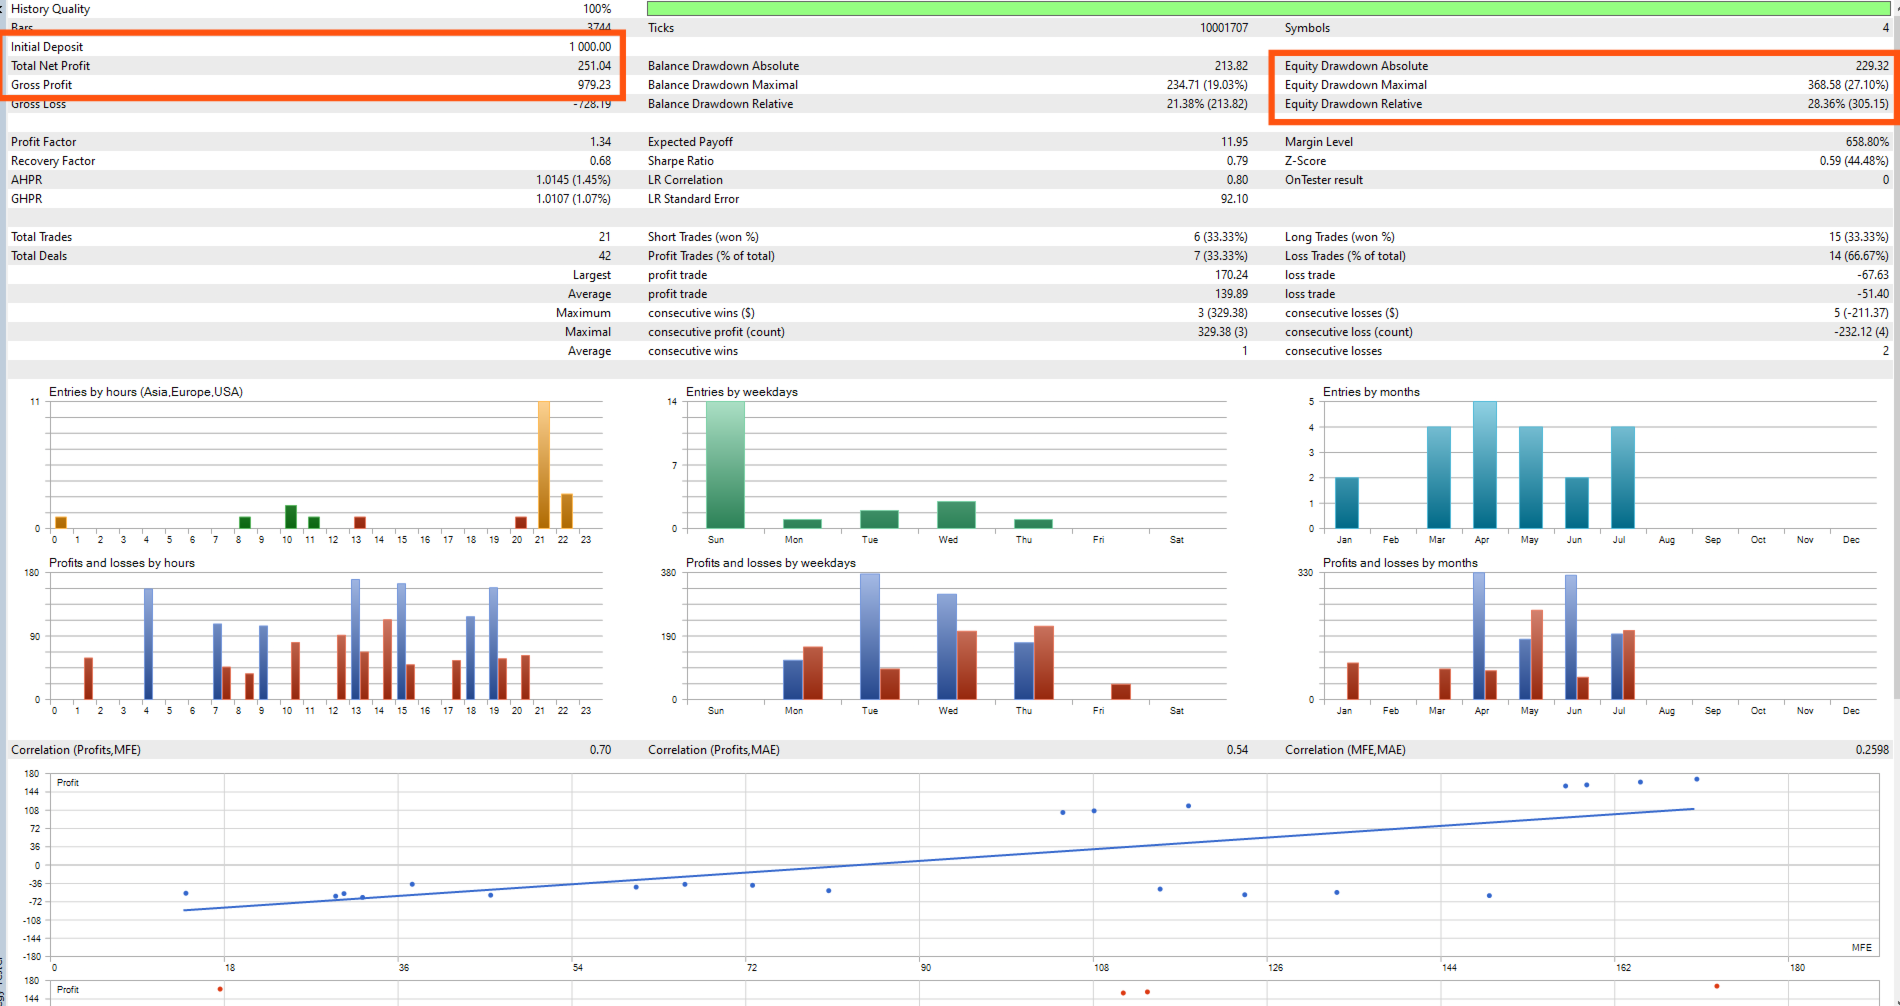
The panel reports balance, equity, daily profit/loss, open trades, win rate and trend status. The two supplied gallery images are a tester report and its balance/equity chart. They can illustrate behaviour, but the report is a developer simulation and the fluctuating equity line should be examined alongside the closed-balance result.
Original developer images — checked 17 September 2026
The two original test images are included below. No separately linked public live account or written customer review was visible on 17 September 2026, so there is no verified live-return claim in this review.
Open the remaining original test images

These are original developer-supplied images, retained without changing their figures. A Strategy Tester report models a selected history and configuration; it does not establish live execution, future returns or independent verification. Click an image to inspect its full-size detail.
Customer feedback and source scope
The MQL5 page showed no customer reviews at our 17 September 2026 check, so there are no customer-review screenshots or third-party star ratings to reproduce. No separate public manual or product-specific signal was linked. The analysis is based on the developer description and gallery, with assumptions kept separate from confirmed features.
Check the current developer listing and feedback
Practical setup
Enable the required broker symbols and test their exact names and contract specifications. The EA manages several currencies from one chart; do not duplicate the same portfolio on multiple charts unintentionally. The public listing does not establish one mandatory timeframe or minimum balance.
Decision points
The developer states that this strategy does not use grid, martingale or averaging into losing trades. That does not remove loss risk: correlated USD exposure can affect several positions together, and actual stop execution can differ from its requested price.