
Oil Bull EA MT5 is Konstantin Kulikov’s buy-only crude-oil grid. It runs from one US crude chart while analyzing multiple timeframes and managing supported oil symbols. Its distinctive appeal is a focused energy strategy with centralized operation; its main consideration is the floating loss that can accumulate across long positions.
Our assessment: the one-chart workflow is straightforward, but the available forward record needs caution. The September 29, 2026 snapshot shows positive realized growth alongside materially lower equity. That makes the balance-to-equity gap more useful than the win rate alone when judging this early account.
Ready to Buy Oil Bull EA MT5?
$239.99 with crypto · $299.99 by card
Official version · Instant download · Free lifetime updates · 7-day money-back guarantee

How the oil grid works
The developer specifies buy entries, multi-timeframe trend analysis and grid behavior that adapts to spread expansion and price velocity. Chart-period independence means the selected display timeframe is not the whole analysis. The adaptive behavior is a developer description; the public material does not expose enough entry logic or parameters to reproduce the strategy independently.
A grid can distribute entries across price levels, but its combined exposure matters more than the appearance of any single trade. If oil continues falling while long positions remain open, the basket can carry losses for longer than the closed-trade statistics suggest. A long bias does not protect capital against a sustained decline.
The listing names US and UK crude symbols. XTIUSD, USOUSD and WTI may identify variants of US crude at different brokers; XBRUSD and UKOUSD commonly refer to the other supported oil market. Treat these as broker-specific contracts and aliases, rather than counting every name as an independent source of diversification. Confirm which symbols the EA actually trades on your account.
The public signal: realized profit and floating loss
The developer links to MQL5 signal 2389242, “Oill Bull”, identified as a real MT5 account on TitanFX-MT5-01. On September 29, 2026 it showed 7.36% growth and €18.24 realized profit from 35 closed trades, all long. The trade distribution was 24 XTIUSD and 11 XBRUSD deals.
The same snapshot showed €868.24 balance and €618.34 equity. Subtracting equity from balance gives €249.90 of floating loss, approximately 28.78% of the displayed balance. This calculation describes that snapshot; it is separate from the signal’s historical drawdown measurements and does not predict what the open positions will eventually realize.
Funding also affects interpretation. The account had an initial €250 deposit, a further €600 in deposits and no withdrawals. Its balance therefore should not be compared with the initial deposit alone to imply trading profit.
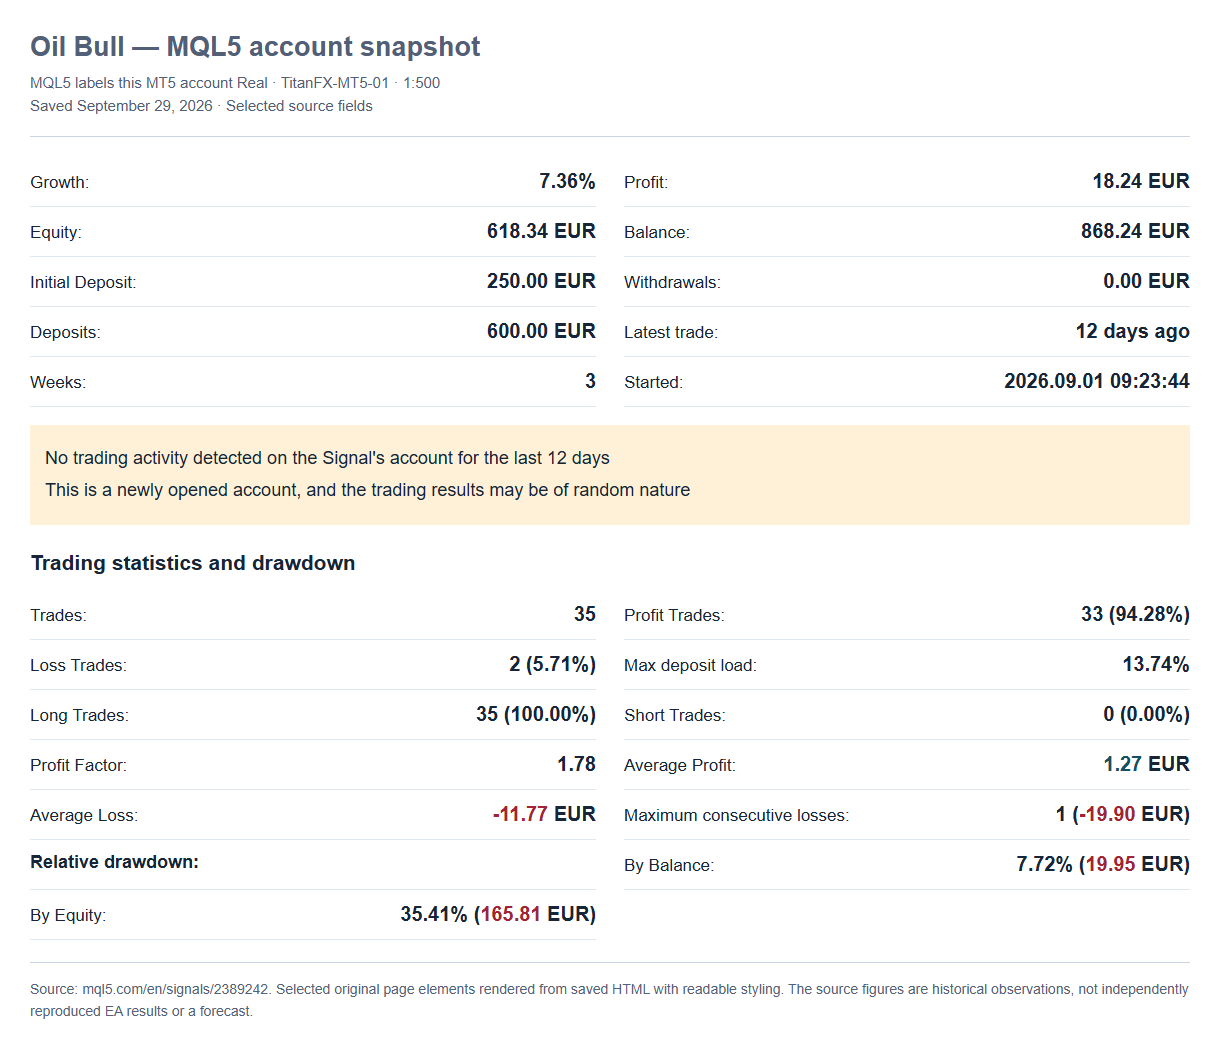
MQL5 reported 7.72% relative balance drawdown and 35.41% relative equity drawdown. The larger equity figure captures risk that a chart of closed results can obscure. With just three weeks displayed and a warning about a newly opened account, this is an early observation rather than evidence of durability through different oil-market conditions.
The snapshot also warned of 12 days without trading activity. Earlier signal notices recorded current-drawdown alerts around 30–32% on September 21 and 23, with some alerts subsequently removed. Those messages belong to the account’s history; removal of an alert does not establish a permanent loss limit or erase the drawdown.
Why a high win rate needs context
The record showed 33 profitable trades and two losing trades: a 94.28% win rate. However, the average profitable trade was €1.27 and the average losing trade was €11.77 in magnitude. A high count of small wins can coexist with a smaller number of much larger losses.
Open positions create another gap in that picture. Closed-trade averages exclude losses still floating in the market. For this account, reading win rate, average win/loss and equity together provides a substantially fuller assessment than taking any one headline as proof of low risk.
What the developer’s test image shows
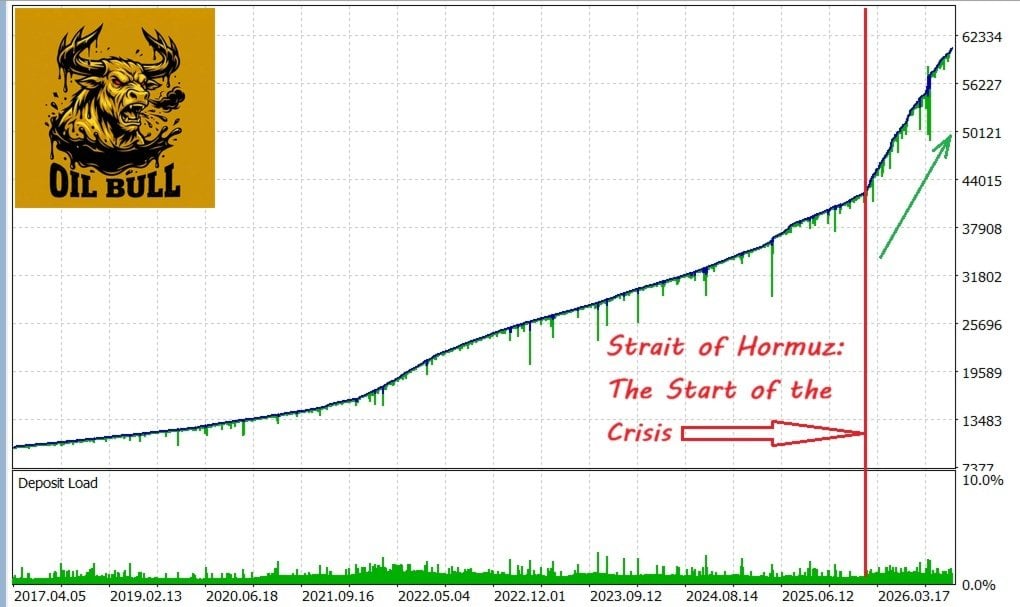
The original developer image spans historical date labels from 2017 into 2026. A smoother rising balance curve sits above visible equity dips. Its crisis label and arrows are the developer’s own annotations; the image alone cannot establish a causal explanation for the later rise.
We have not independently reproduced this test. A graph cannot supply all the assumptions needed to compare it with a broker account: contract specification, spread, financing, sizing, execution model and the exact settings are material. The current forward account’s equity drawdown is especially relevant when evaluating the smoother historical presentation.
Setup checks and practical limitations
Attach Oil Bull to one supported US crude chart and verify the broker’s symbol mapping. Review contract size, minimum lot, margin requirements and trading sessions before choosing exposure. Overnight financing is broker-specific, so the developer’s positive-swap claim should not be assumed to apply to every long oil position.
The public listing showed version 1.0 at this review. It says detailed installation instructions are supplied privately after a direct developer purchase; no public manual was available in the source material reviewed here. We therefore cannot independently document every input or claim that the developer’s private support and purchase bonuses accompany the CheaperForex offer.
Customer feedback

The listing contained one customer review, posted by Rahul Song on September 7, 2026. The selected excerpt concerns setup and the developer’s responsiveness. It is an individual customer opinion, predates the later drawdown alerts and supplies no account-level evidence. It is separate from CheaperForex purchase ratings and does not establish the support terms of this offer.
Oil Bull and Trust EA serve different markets
Kulikov’s Trust EA MT4 and Trust EA MT5 focus on Forex trading around rollover. Oil Bull adds a distinct oil-market approach, with its own contract and basket-exposure considerations. The shared developer does not make either strategy a substitute for assessing the other’s results.
Oil Bull’s clearest attraction is its dedicated crude-oil workflow. The key unresolved issue is how its long-only grid handles extended adverse moves: the short forward history already shows why equity, open exposure and account funding need to stay central to that assessment.
Frequently asked questions
Is Oil Bull’s linked signal a real account?
MQL5 identified the linked account as real and running MT5 on TitanFX-MT5-01. The September 29, 2026 snapshot had a short three-week history and warnings about account age and inactivity. A real-account label does not establish that the strategy is low risk.
Why do Oil Bull’s growth and equity figures differ?
The signal’s growth and realized profit figures need to be read alongside open exposure and funding. On September 29, 2026, balance was €868.24 while equity was €618.34, a €249.90 gap. The positive realized result therefore coexisted with material floating losses.
Do the oil symbol names represent independent assets?
No. Some names are broker aliases for the same underlying crude market. The developer describes management of US and UK crude contracts from one US crude chart. Confirm symbol mapping, contract size, margin and financing terms on the intended broker.
Does the developer’s backtest establish expected returns?
No. The published chart is developer-supplied historical evidence that we have not independently reproduced. Its assumptions and the EA’s complete settings are needed for a meaningful comparison, and the available forward account already shows substantial equity drawdown.
Sources checked September 29, 2026: Oil Bull listing, developer images and customer feedback; linked MQL5 signal. This review analyzes those public materials; we have not independently traded or backtested the EA. CheaperForex sells this product. Trading can result in losses.