
AudCad Grid Pro is an AUDCAD M30 robot for MetaTrader 4, combining averaging-down grid entries, range/trend switching and hedge locking. Its most distinctive practical feature is the chart panel: you can place manual orders, switch operating modes and toggle automatic lot sizing without working through a long input list.
Our recommendation: PrismAlgo is the better choice for traders who want a broader MT5 system with ongoing cloud updates and a public performance record to inspect. AudCad Grid Pro focuses on one AUDCAD grid-and-hedge setup. We prefer PrismAlgo for its wider market access and maintained decision layer, rather than relying on this EA’s developer backtests alone.
This is a feature-and-evidence assessment, not a controlled comparison of returns. PrismAlgo still carries trading risk and requires MT5 and an available cloud connection. Commercial disclosure: CheaperForex offers PrismAlgo.
Trade all 28 Forex pairs, including AUDCAD, with PrismAlgo. It also has a public live record on Myfxbook you can inspect. No public live signal was linked for AUDCAD Grid Pro in the developer sources reviewed here.
AUDCAD source material and screenshots checked 14 September 2026; the original listing was published on 12 September 2026. PrismAlgo comparison updated 23 September 2026. The AUDCAD evidence below remains a dated review of that material.
How the strategy manages AUDCAD
The developer describes a regime detector that distinguishes ranging from trending conditions and adapts its entries. Grid averaging adds exposure around adverse movement, while hedge locking places an opposing trade against a losing position. The listing does not publish the full regime formula, grid spacing, unlock rules or an account-level maximum-loss limit.
A hedge can reduce net directional exposure while both sides remain open, but it does not turn an existing floating loss into a profit. Margin rules, transaction costs and the eventual release of the lock still matter. A prolonged trend can create different conditions from the reversals on which an averaging basket depends.
Manual controls explained
Review annotations: Manual controls and drawdown labels
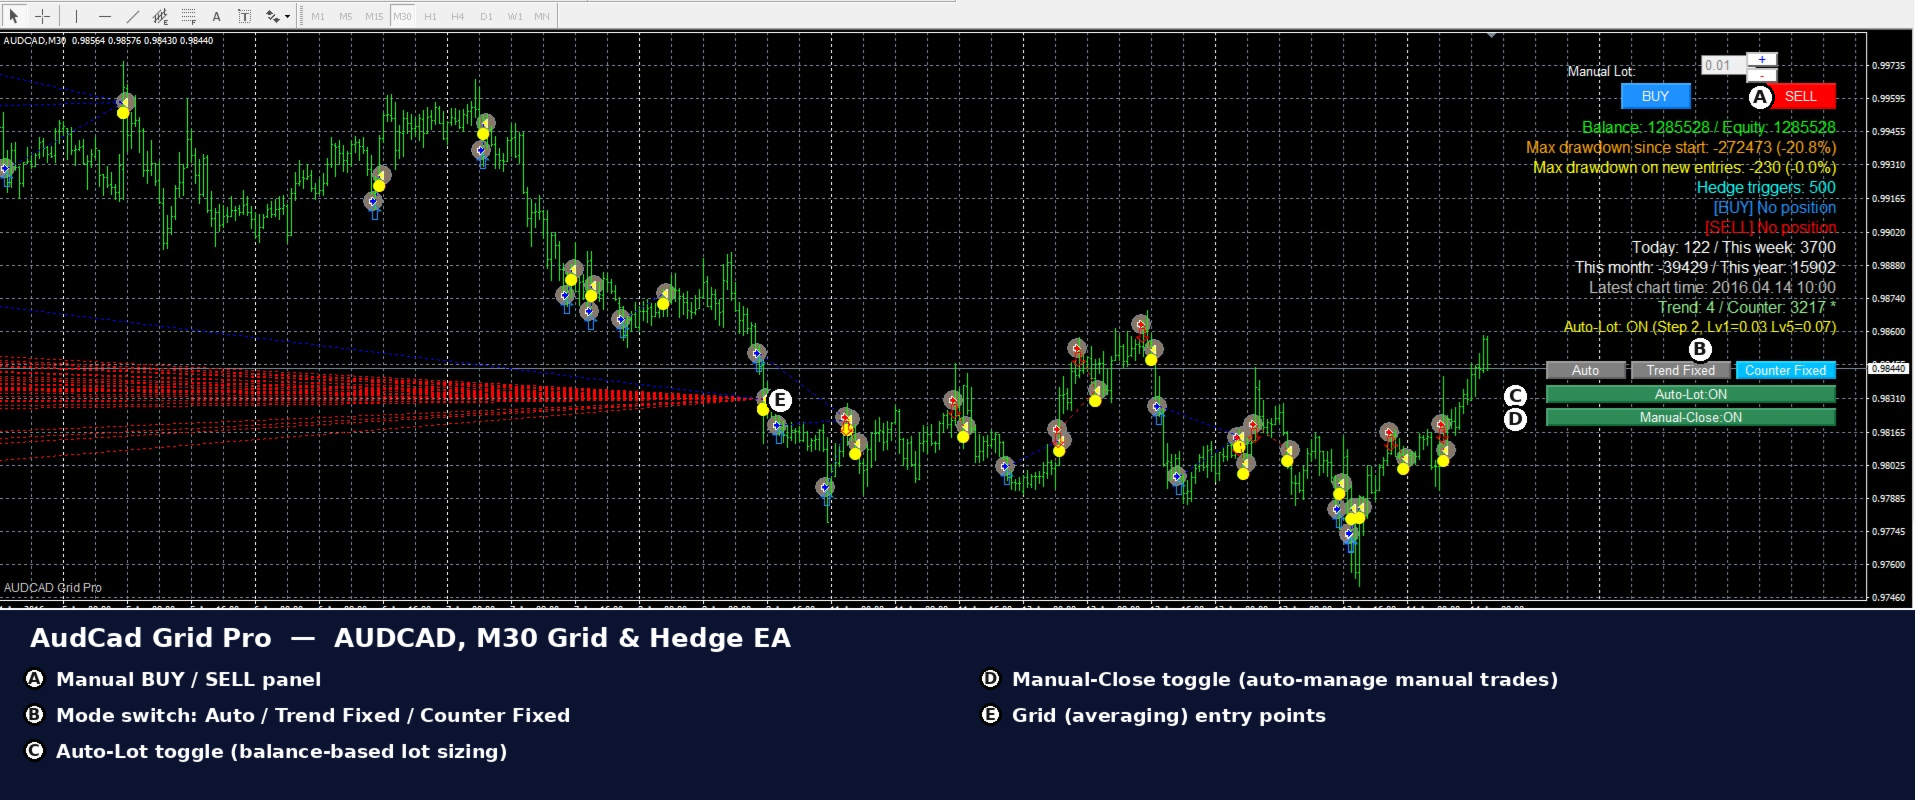
On a narrow screen, swipe across the screenshot to inspect the details. Numbered explanations follow below.
- Different drawdown labels. The panel distinguishes drawdown since start from drawdown on new entries. These are different measures; a small new-entry value does not cancel the earlier account experience.
- Mode selection. Auto, Trend Fixed and Counter Fixed change the operating mode. The neighbouring Auto-Lot and Manual-Close switches control other behaviour, so the active panel settings matter.
The A–E labels identify manual entries, regime override, balance-based sizing, manual-position management and grid entries. The screenshot is a historical chart illustration: its displayed chart time is April 2016. It should not be presented as a current funded account.
The BUY/SELL panel accepts a manual lot value with 0.01 increments. The EA can then recognise those manual positions and apply averaging follow-up and take-profit management. Manual-Close enables or disables that automatic handling; the name should not be read as an immediate close-all command.
Auto / Trend Fixed / Counter Fixed lets the user leave regime selection automatic or lock a mode. Auto-Lot toggles the balance-step sizing table. Although Lot is the only listed external input, these on-chart switches change behaviour materially. Confirm their active state before leaving the terminal unattended.
Automatic lot sizing and account currency
The developer says its balance-step table is currency-aware for JPY and non-JPY accounts and enabled by default. The written listing does not disclose the full balance thresholds or convert them into a universal percentage-at-risk figure. Balance-based sizing should not be confused with an equity-loss ceiling, particularly when floating losses and several positions coexist.
The dashboard reports balance, floating P/L, maximum drawdown and daily, weekly, monthly and yearly profit. Those views are useful for operation, but the meaning of each drawdown field should be checked. The screenshot separates drawdown since start from drawdown on new entries; a small value in one field does not erase a larger value in another.
What the balance and equity curves show
Review annotations: Closed balance versus floating equity
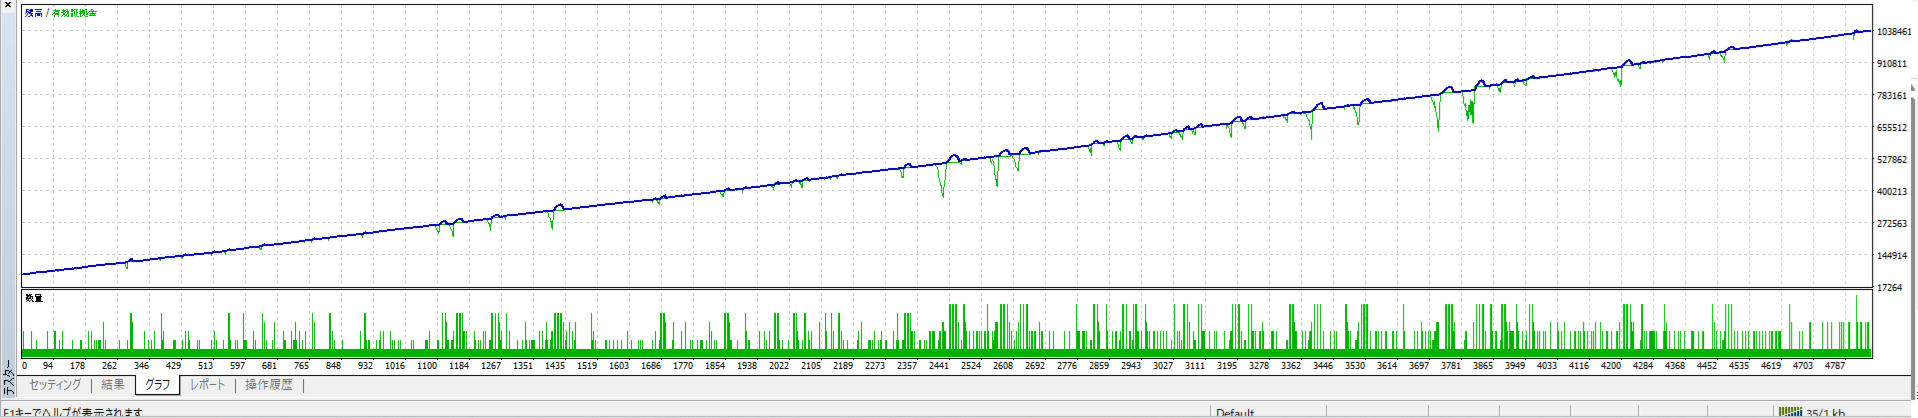
On a narrow screen, swipe across the screenshot to inspect the details. Numbered explanations follow below.
- Equity dip below balance. The green equity curve drops below the blue balance curve here. That gap shows floating losses during this historical test, even while closed balance rises.
- A second equity dip. Another separation appears later in the same curve. Several dips in one simulation are not independent live-account records.
The blue balance curve rises relatively smoothly, while the green equity curve drops below it at several points. For a grid system, that distinction is central: closed profit can accumulate while open positions carry losses. Assess equity, margin and time spent in a locked basket, not just the slope of closed balance.
Review annotations: Trade sizes and a losing close
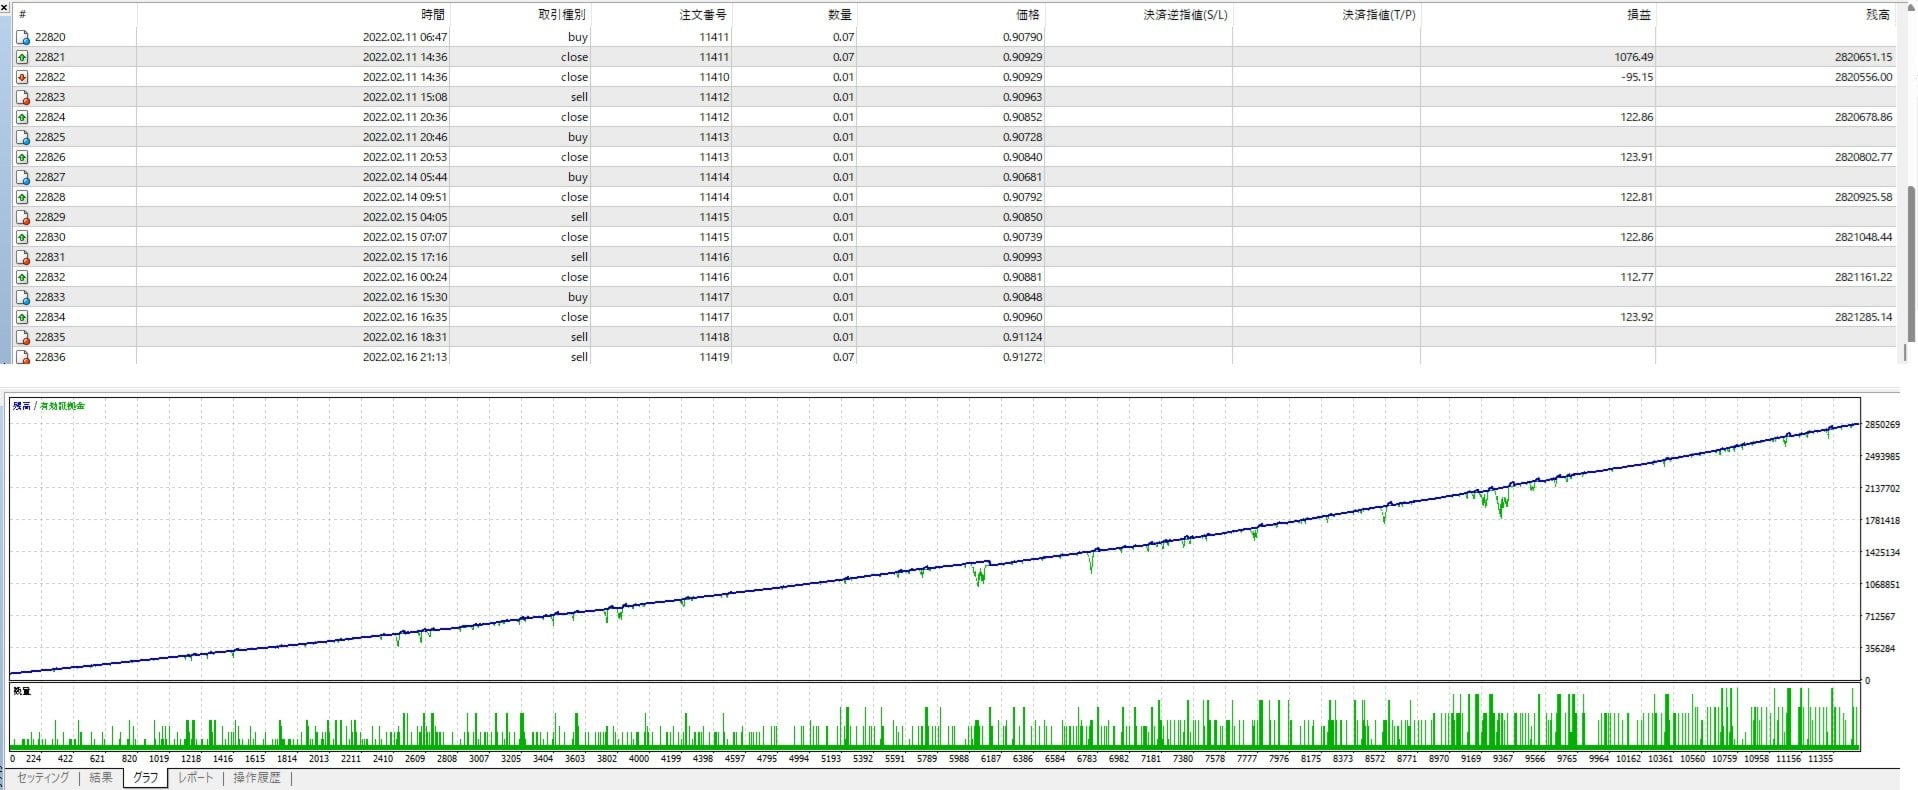
On a narrow screen, swipe across the screenshot to inspect the details. Numbered explanations follow below.
- Varying position sizes. The quantity column shows 0.07 alongside later 0.01 entries. This screenshot does not establish one fixed risk amount for every trade.
- Negative closure. The highlighted row records a negative result of 95.15 account-currency units. A rising cumulative balance does not mean every closed trade wins.
This view includes historical trade rows with varying volumes and both positive and negative closures. The visible stop-loss and take-profit columns do not establish a hard broker-side stop on every displayed order. The screenshot also cannot establish the complete basket exit rules or the execution a different broker would provide.
Review annotations: Later historical rows and equity exposure
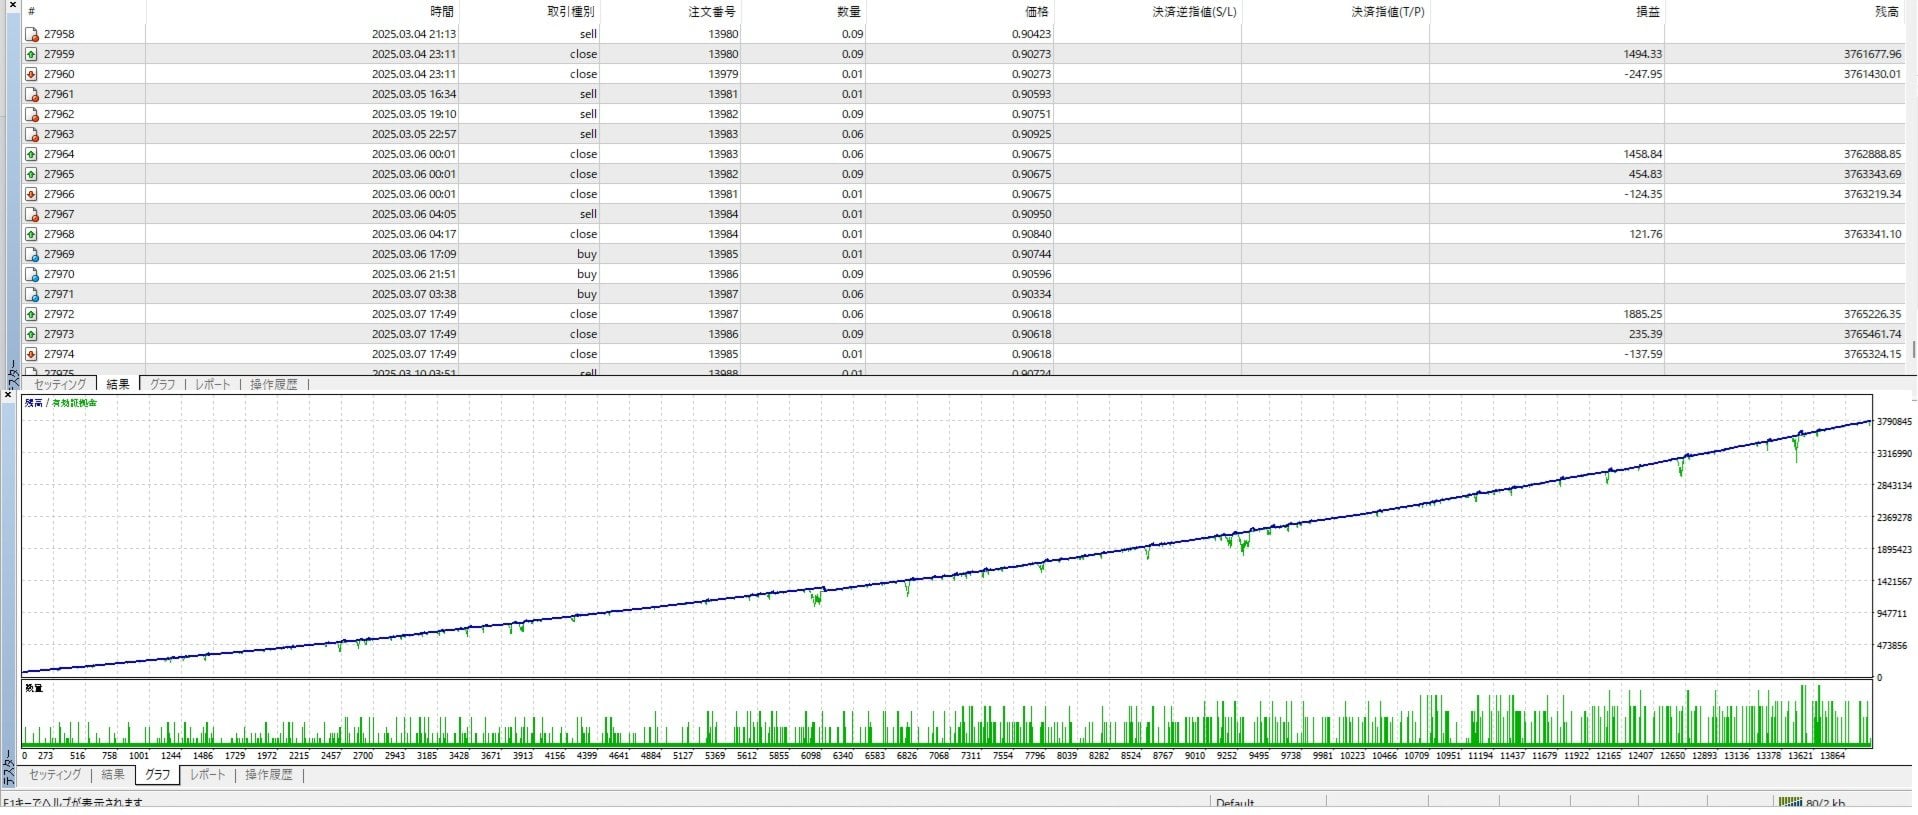
On a narrow screen, swipe across the screenshot to inspect the details. Numbered explanations follow below.
- A losing trade in the later sample. The March 2025 rows include a negative 247.95 result as well as positive closures. Both sides of the trade distribution belong in the assessment.
- Floating-equity separation. The green equity curve again dips beneath balance. This is another historical tester view, not a separate verified live signal.
The later view extends the historical illustration and again shows equity dips underneath balance. It adds context, but it is not an independent second account or separate third-party verification. Multiple screenshots from a test should not be counted as multiple live track records.
Test conditions and the supplied report
Review annotations: The assumptions behind the backtest
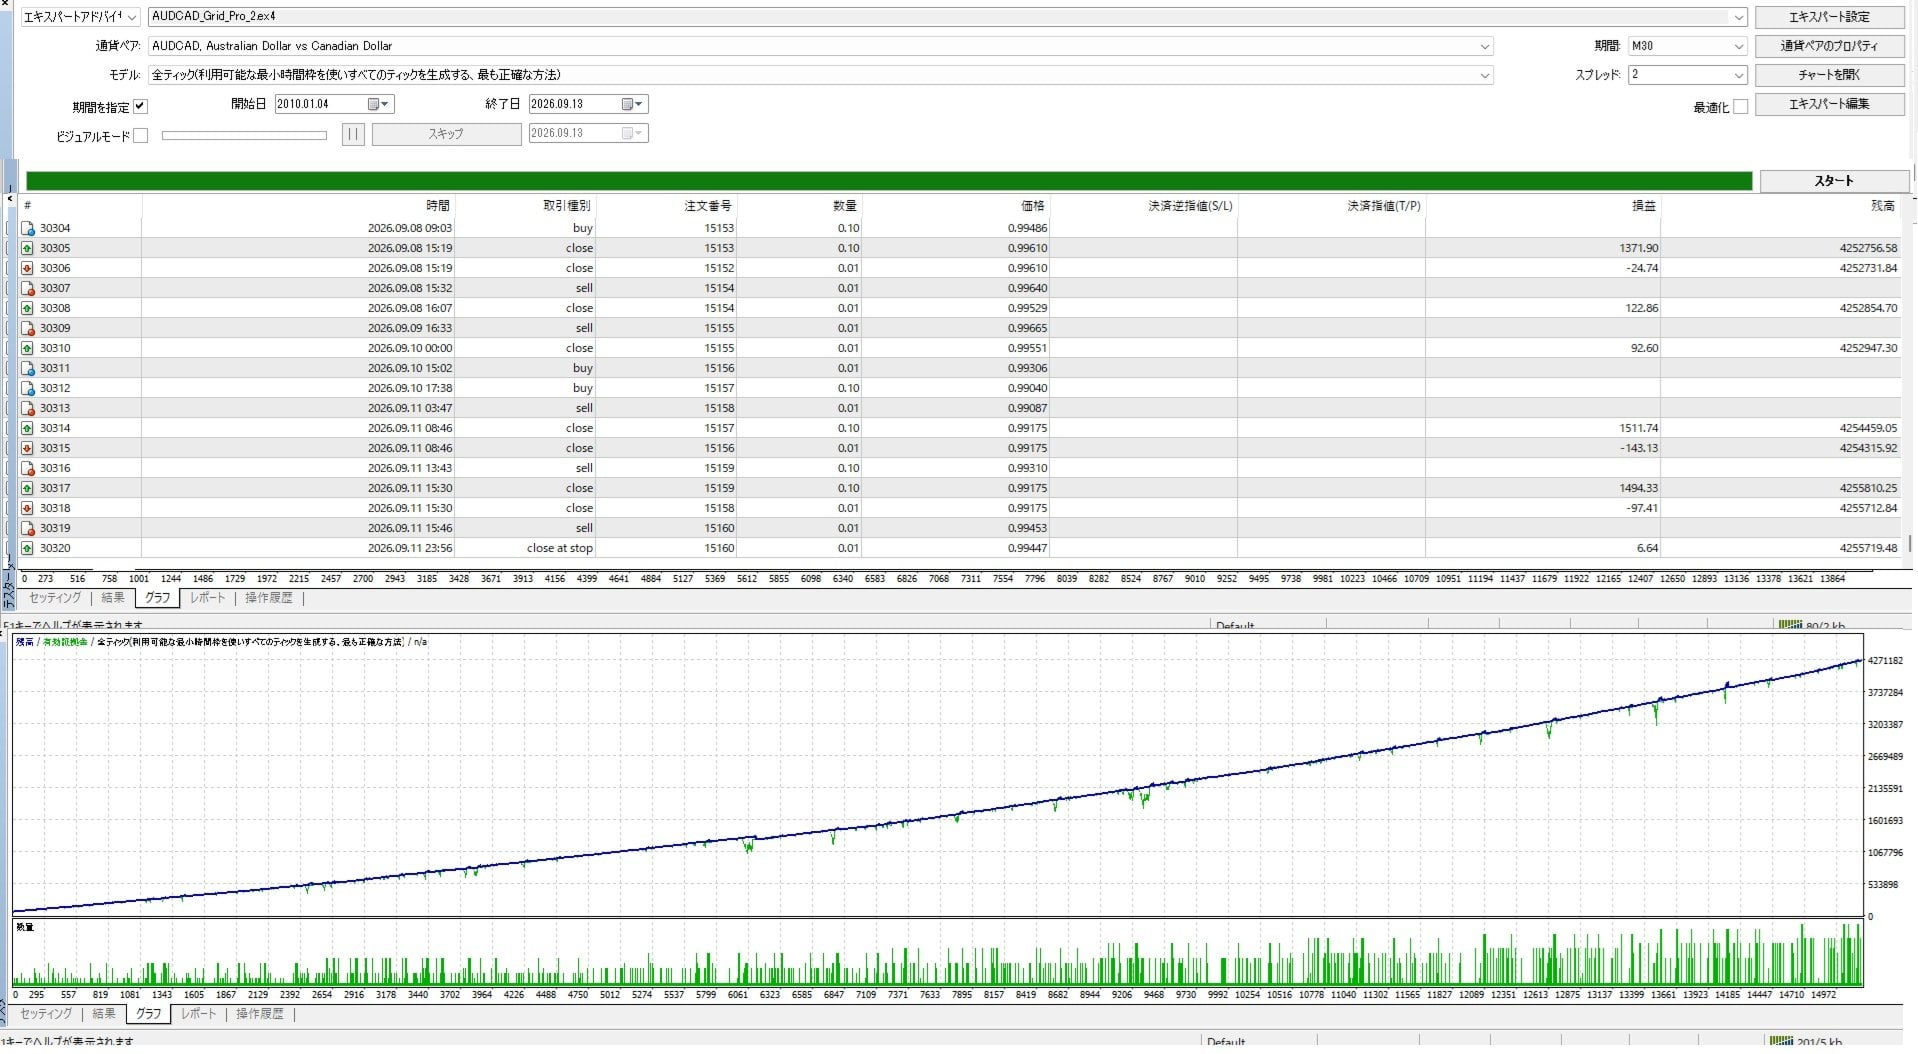
On a narrow screen, swipe across the screenshot to inspect the details. Numbered explanations follow below.
- Historical test window. The start field shows 2010.01.04 and the end field shows 2026.09.13. This is a configured simulation window, not the age of a retail live account.
- Spread input. The spread field is set to 2. That input alone does not demonstrate performance under changing live spreads, commission and slippage.
The settings image shows AUDCAD, M30, an Every tick model, a start date of 4 January 2010 and an end date of 13 September 2026, with the spread input set to 2. The report’s modelling-quality field is n/a. Do not translate that into a 99% quality claim or assume the test reproduces changing live spreads and slippage.
Review annotations: Keep the report’s measures separate

On a narrow screen, swipe across the screenshot to inspect the details. Numbered explanations follow below.
- Profit factor: 2.49. This report shows 2.49. The reviewed written description quoted 2.57; the screenshots do not establish that both figures came from the same test settings.
- Relative drawdown: 27.93%. The relative-drawdown field is 27.93%. The separately labelled maximal-drawdown field shows 402,579.87 (11.30%); these fields are not interchangeable.
- Initial deposit
- 66,000 account-currency units; the screenshot does not establish that these are US dollars.
- Net profit
- 4,189,719.48 in the supplied simulation.
- Profit factor
- 2.49 in this report.
- Total trades
- 15,160.
- Relative drawdown
- 27.93% (142,428.65).
- Maximal drawdown
- 402,579.87 (11.30%), a different report field from relative drawdown.
The description and screenshot differ: the written listing quotes a profit factor of 2.57, while this supplied report shows 2.49. The public material does not explain which settings or test period produced the quoted 2.57. We retain the original figures and distinguish them instead of silently combining the most attractive statistics.
The report shows 76.39% winning trades, but average losing trades are larger than average winning trades: 784.69 versus 604.28 account-currency units. A high win rate alone therefore does not describe the payoff profile. These are historical simulated figures, not independently verified returns or an expectation for a buyer’s account.
Developer video and customer feedback
Watch the developer-linked AudCad Grid Pro demonstration (6 minutes 35 seconds). Its Japanese description identifies it as a reference recording of the AUDCAD M30 grid/hedge system, including regime detection and balance-step sizing. It is an operational illustration, not a promise of future results.
The MQL5 Reviews area showed no reviews and its Comments page had no public discussion at our source check. There are no customer testimonials to screenshot yet. No separate public manual or monitoring signal was linked from the listing or seller page we inspected. The retail publication date is September 2026; the historical test period is not the length of a retail live record.
Why we prefer PrismAlgo to AudCad Grid Pro
The most useful comparison is how each system operates and what you can verify before choosing it. AudCad Grid Pro combines single-pair basket management with manual intervention. PrismAlgo is our preferred option for users moving to a broader, centrally maintained MT5 service.
- Market coverage
- AudCad Grid Pro is built around AUDCAD M30. PrismAlgo’s current plans cover 28+ Forex pairs, with Gold and Bitcoin available on its Complete and Lifetime VIP plans. This offers more choice; it does not make correlated positions risk-free.
- Ongoing strategy updates
- AudCad Grid Pro describes local regime switching. PrismAlgo’s cloud engine is maintained centrally, so its strategy can be refined for every connected MT5 account without a new EA file. Those are different mechanisms; a local EA can respond to conditions without having a remotely maintained decision layer.
- Evidence you can inspect
- The AUDCAD material reviewed here contains simulations and a demonstration. PrismAlgo links to a public Myfxbook account, providing a trading record to examine alongside the product description. Check current equity, drawdown, open exposure and history rather than treating a headline gain as a forecast.
- Platform and service requirements
- AudCad Grid Pro runs on MT4. PrismAlgo requires MT5, a suitable licence, an operating terminal or VPS and connectivity to its service. It is not a drop-in replacement for an MT4 file.
These differences make PrismAlgo a better fit in our view for someone seeking wider market choice, ongoing central maintenance and accessible performance reporting. They do not establish that it will earn more or lose less in every period. Anyone restricted to MT4 needs to account for the platform change.
Read how PrismAlgo’s cloud-connected system works · Compare current PrismAlgo plans and supported markets
AudCad Grid Pro: practical limitations
The focused pair/timeframe and chart controls make the intended setup straightforward to identify. The developer recommends tight-spread ECN/Raw-type execution. Check commissions, swaps, hedging support and locked-position margin with the actual broker rather than assuming the account label answers all of those questions.
This EA is most relevant to someone comfortable supervising grid baskets and testing both automatic and manual modes. Anyone seeking a documented fixed maximum account loss or a mature public live signal should recognise that the currently linked material does not establish either. Test how the system handles a sustained directional move and the release of a hedge, not just a favourable ranging period.
Read the original product specification · Check current MQL5 customer reviews · Read product comments
Our verdict
AudCad Grid Pro’s chart panel is useful, but its averaging and hedge-locking approach needs careful supervision, and the evidence reviewed here does not establish a public live record. PrismAlgo is our recommended alternative for traders willing to use MT5 who value broader market coverage, cloud-based maintenance and results they can inspect.