
BTCUSD Consensus EA selects Bitcoin trades on H1 through five embedded model ensembles and market-regime analysis. Leonid Arkhipov offers separate MT4 and MT5 editions, both describing one position at a time, up to three daily entries, defined stops and optional Recovery. The dashboard exposes model scores and execution permissions behind each trading decision.
Edition and evidence scope — October 6, 2026: this shared review covers BTCUSD Consensus EA MT4 and BTCUSD Consensus EA MT5. The MT4 listing links to the same guide, interface illustration and tester archives as MT5. The 38-page guide and original reports describe MetaTrader 5. Detailed defaults and historical results below therefore refer to that MT5 documentation; they are not separate verification of the MT4 build. Check the actual MT4 Inputs before applying guide settings.
Our assessment: this is a model-based Bitcoin EA with unusually detailed public documentation and downloadable tester reports. It suits traders who want to examine fixed entry logic and broker settings. The main considerations are the MT5 guide’s default ×2 Recovery after losses and evidence dominated by historical testing. A newly linked MT5 signal began monitoring today and shows only two trades; neither it nor the simulated returns establishes a mature monitored live record.
View BTCUSD Consensus EA MT5 features and pricing View BTCUSD Consensus EA MT4 features and pricing

We inspected the MQL5 listing, its 38-page English guide ZIP, release notes, comments and both original tester reports on October 5, 2026. We have not independently run the EA or audited the training pipeline. Original developer images appear below with their dates and evidence limits; the cover is separate promotional artwork.
What the five models actually do
The guide describes four base ensembles assessing long and short opportunities, plus a SELL META ensemble providing additional short validation. Together they contain 1,360 trained decision trees. Their inputs include closed H1 price structure, returns, volatility, EMA relationships and the four M15 quarters within an hour. The base feature set contains 61 inputs; SELL META adds the other model scores and regime flags.
Regime classification distinguishes upward, downward, flat, compression, expansion and transition conditions. A regime influences entry thresholds rather than forcing a trade in that direction. Insufficient model agreement or a failed execution gate leaves the system waiting. A large model count is a design detail, not independent proof of predictive accuracy.
These models are embedded and pretrained. According to the guide, they do not learn online from your account and do not require external Python, DLLs or cloud AI for decisions. Internal model thresholds and core stop/target rules are fixed in this build; user inputs primarily govern execution, risk, broker time and the interface.
One position, ATR exits and an informative dashboard
- Market
- BTCUSD H1 on one MT5 chart, with internal H1/M15 analysis and supported symbol suffixes.
- Trade constraints
- One Bitcoin position at a time; maximum three entries per UTC day. The guide describes no grid or averaging against a losing move.
- Initial exits
- Stop loss and take profit each use 1.0 signal-H1 ATR, giving approximately 1:1 planned distances.
- Time exit
- Close after 12 hours if neither stop nor target has been reached.
Actual trade outcomes need not finish at exactly +1R or −1R: costs, execution and the timed exit can change the realized result. The broker-validation gate can reject an entry when the intended stop or tick-size requirements cannot be met, rather than widening the validated stop to fit.
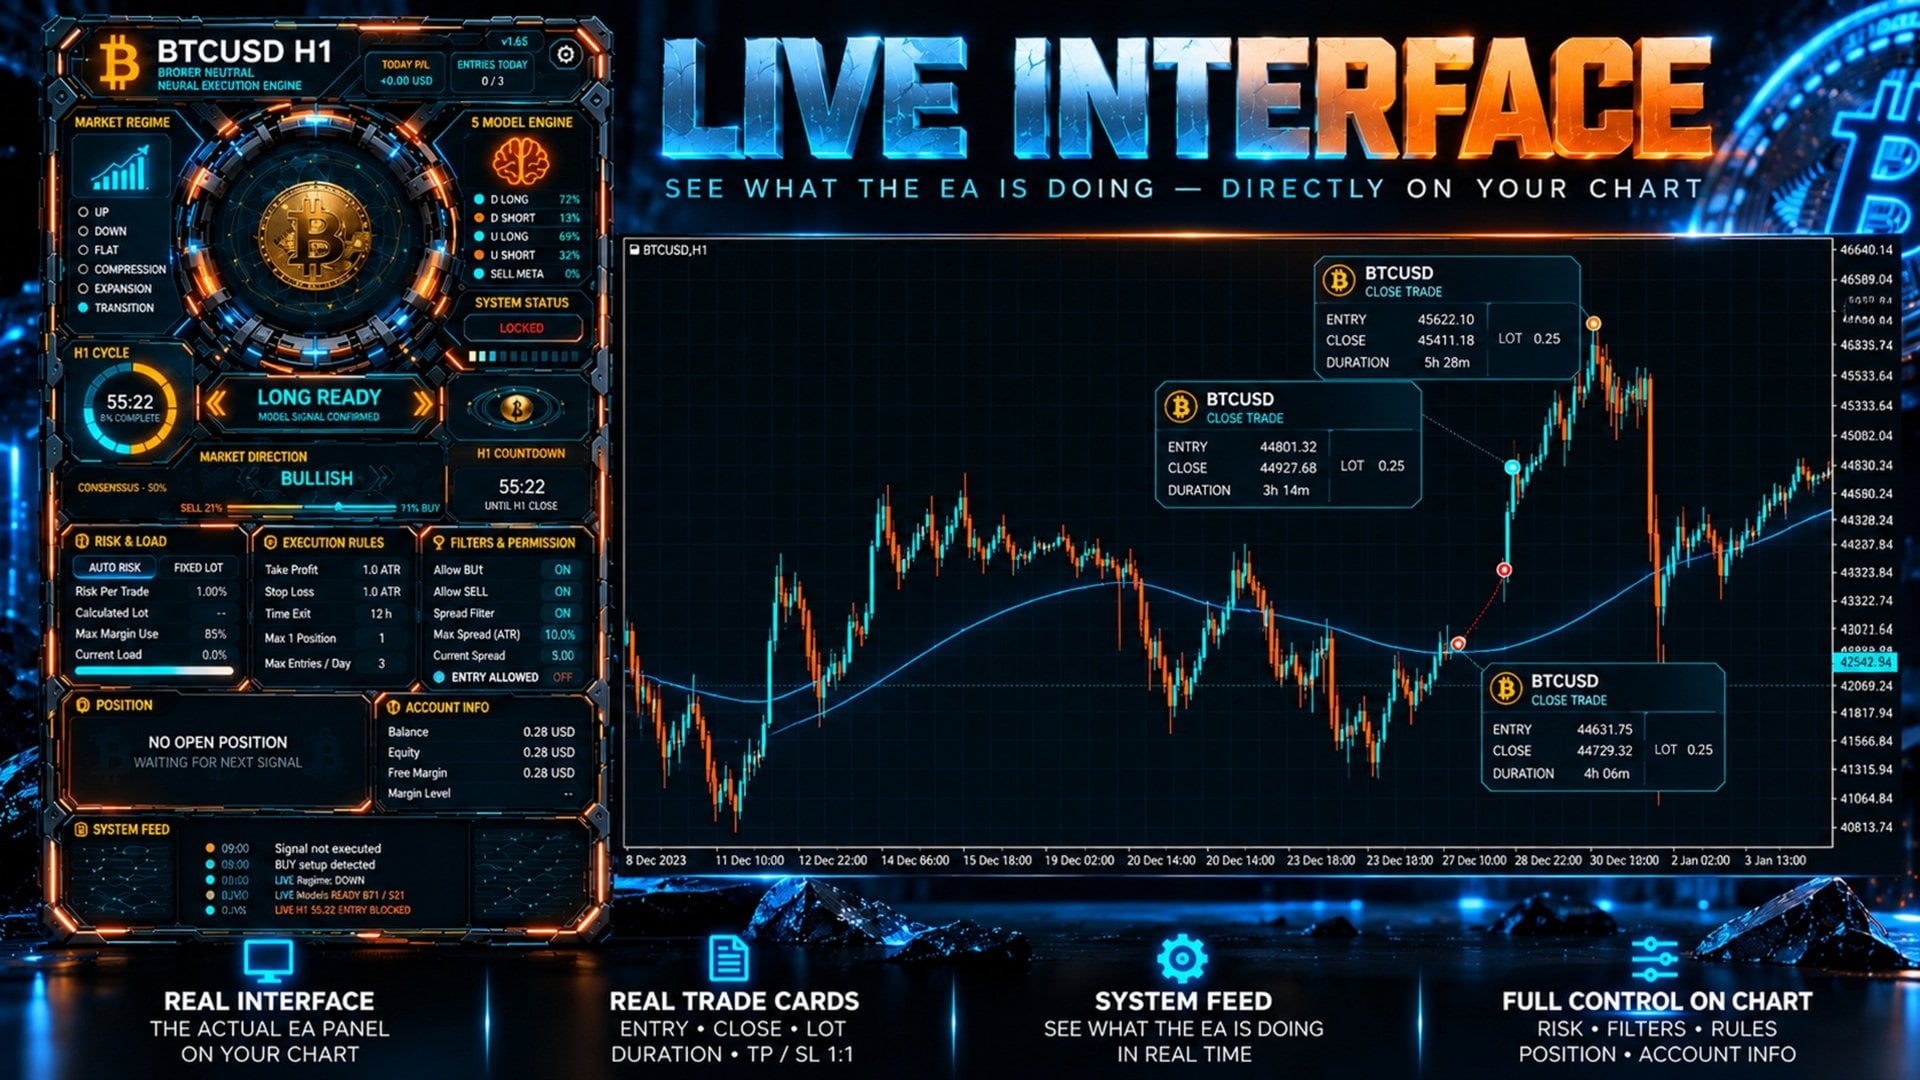
The panel shows regime, model evaluations, H1 cycle, consensus, risk/load, filters, open position and account information. Closed-trade cards help inspect individual outcomes. The original interface illustration uses historical candles; an updating panel described as a “live interface” is not evidence of live-money performance.
The MT5 guide’s default Recovery changes the meaning of 1% risk
Auto Risk uses equity and the monetary value of the intended stop; fixed-lot sizing is an alternative. Defaults are a 1% base Auto Risk setting, a 0.01 fixed lot and Maximum Margin Use of 85%. Broker minimum/maximum volume, lot steps, contract size and margin can alter the calculated position.
- After a loss
- Recovery, enabled by default, multiplies subsequent volume by ×2.
- After another loss
- Volume remains at ×2; it does not escalate to ×4, ×8 or further doubling.
- After a profit
- Return to the base sizing.
- Recovery disabled
- Remove this increased-volume step; signals and stop/target rules remain the same.
This is a bounded increase in sizing after losses, so the base 1% setting should not be advertised as a fixed maximum on every trade. A Recovery trade can approximately double planned stop risk before broker and margin adjustments. No-grid operation does not mean there is no recovery sizing.
The 85% margin limit controls volume using margin allocation; it is not a cash-loss or drawdown ceiling. One-position operation prevents a grid of simultaneous positions, but consecutive losing trades still accumulate account losses. Inspect actual cash risk and the Recovery state before evaluating a result as a constant-risk trade.
Broker time and spread behavior need careful setup
Default GMT Offset +2 and DST enabled correspond to winter UTC+2 and summer UTC+3. The models normalize broker timestamps to a common UTC grid. Incorrect settings shift H1/M15 candle boundaries and can change the features and signals. A broker using UTC+0 throughout the year instead needs offset 0 and DST disabled.
Spread protection compares Ask−Bid with ATR, using a default maximum of 10% of ATR. The manual discloses an important historical difference: tester entries before 2026 intentionally bypass the rejection filter, although real Bid/Ask spread still affects execution. From 2026 onward the tester applies the enabled filter normally. The multi-year test therefore does not apply identical spread-rejection behavior throughout its history.
The developer recommends low-spread ECN/RAW-type conditions and testing on the intended broker’s real-tick history. His 500 USD deposit guidance assumes a 0.01 minimum lot and 1:500 leverage; different Bitcoin contracts and margin requirements can make that guidance unsuitable. Portability across broker symbols is different from identical fills or results. A stable VPS supports terminal continuity, but does not eliminate slippage or price-feed differences.
The long historical report differs from the promotional table
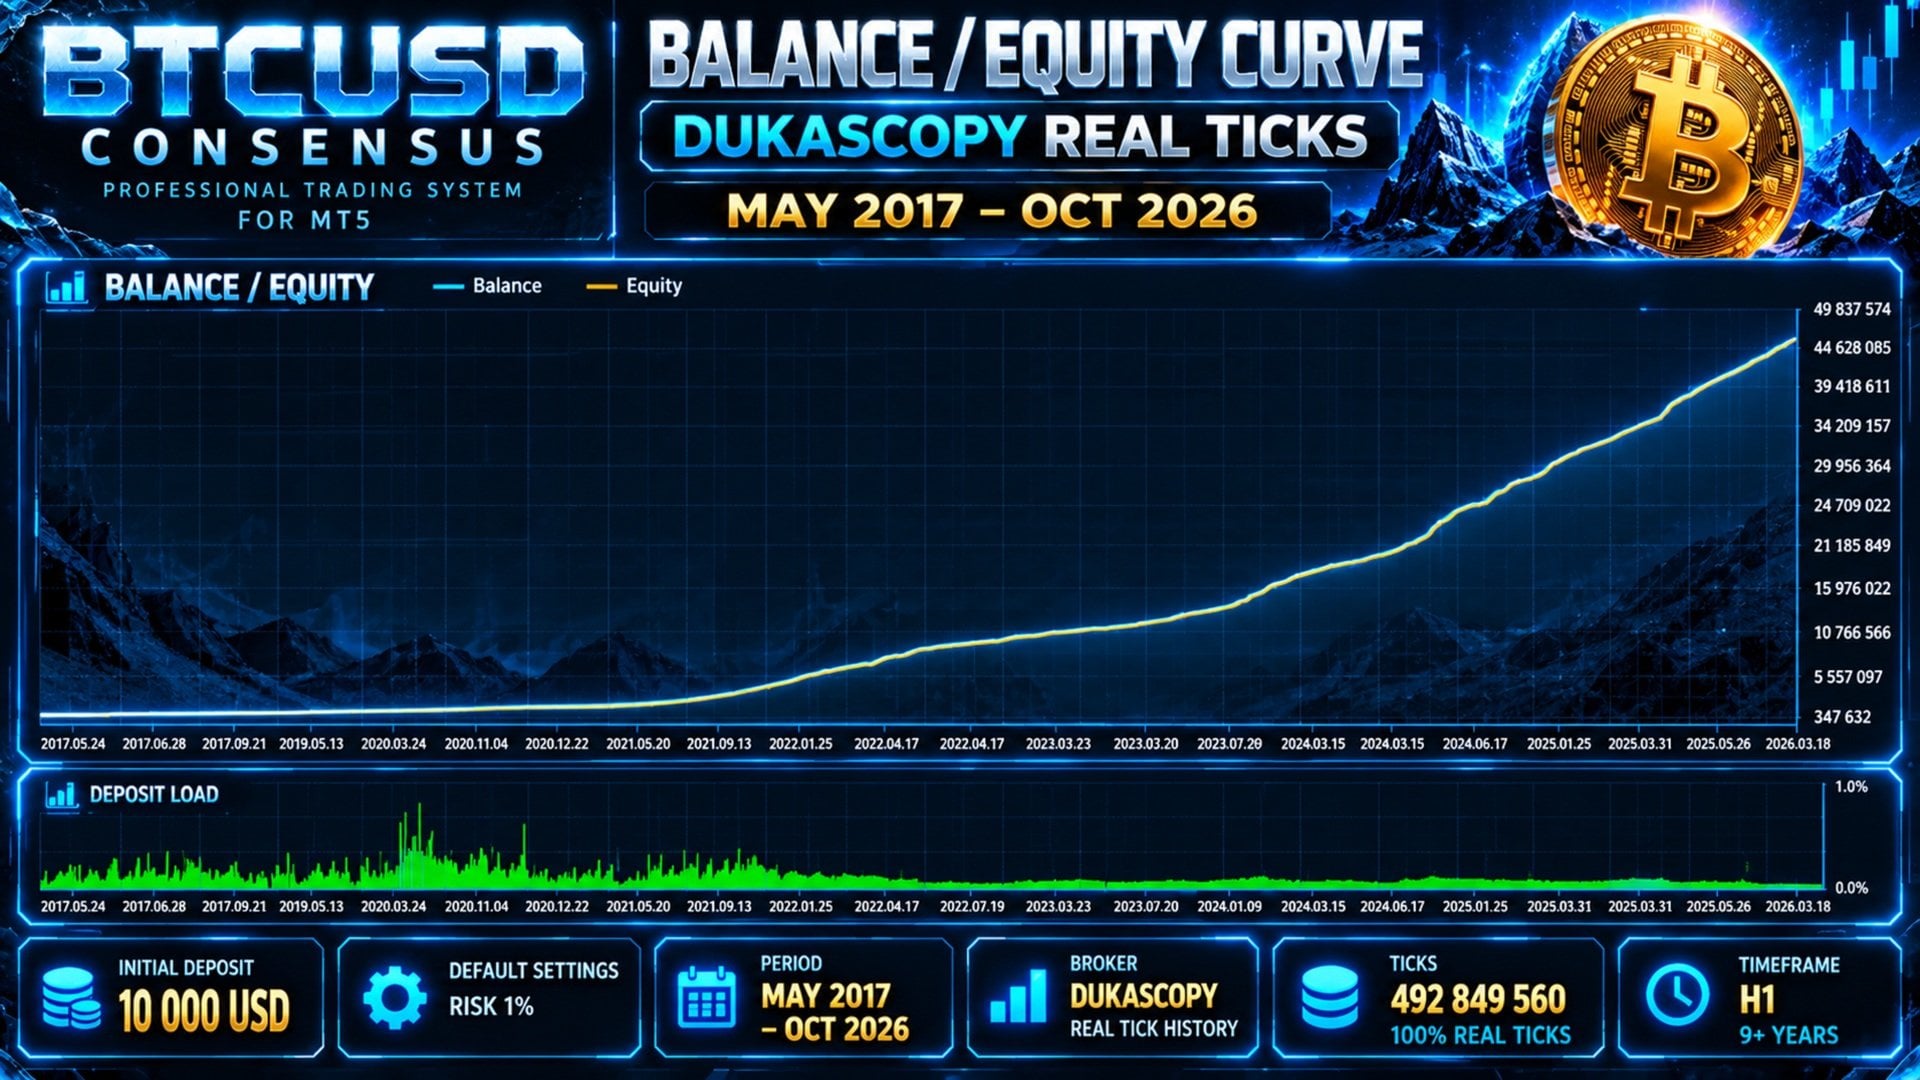
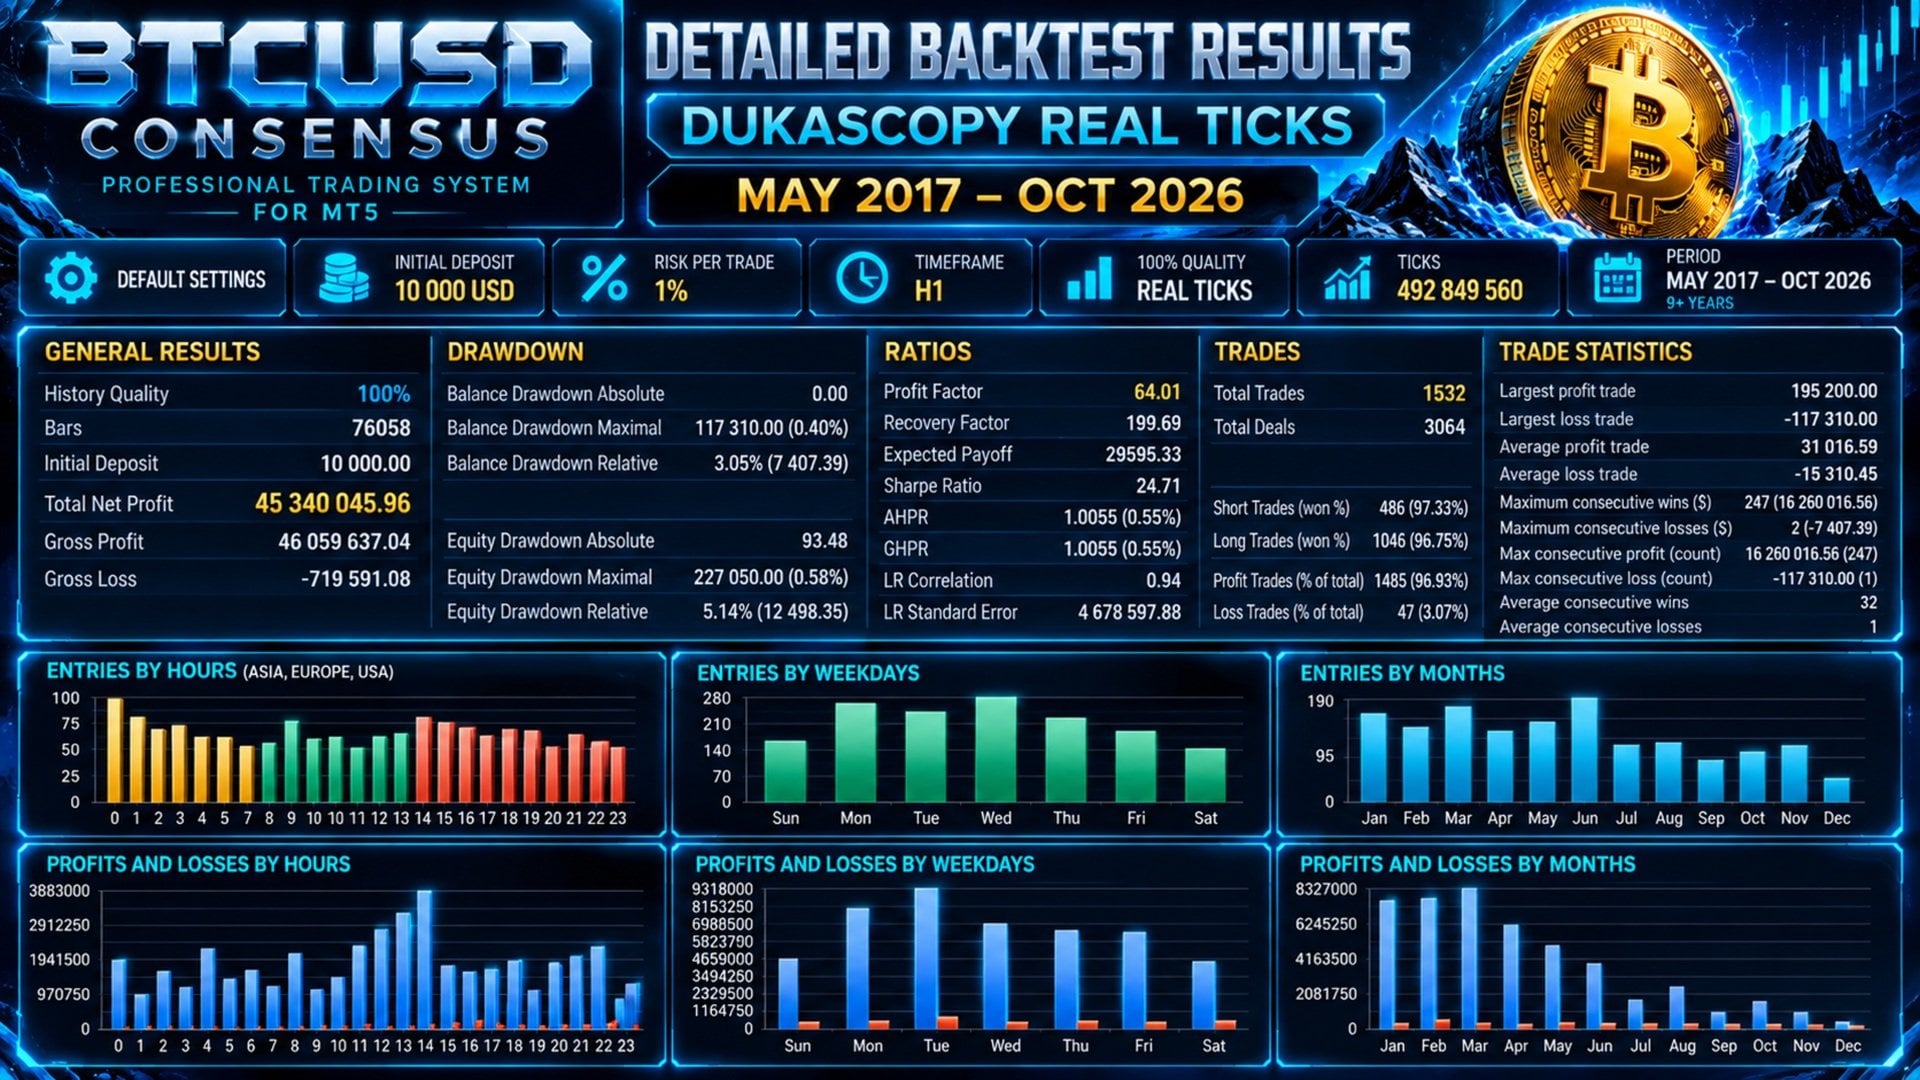
The original long tester report ZIP covers May 8, 2017–October 2, 2026 on BTCUSD H1 using 492,849,560 Dukascopy real ticks. It uses a USD10,000 initial deposit, 1:100 leverage, Auto Risk 1% and Recovery enabled at ×2. The report contains 1,532 trades, with 1,485 winners and 47 losers (96.93% wins).
- Gallery presentation
- Profit factor 64.01 and relative equity drawdown 5.14%.
- Downloaded report
- Profit factor 64.76 and relative equity drawdown 5.13%; relative balance drawdown is 3.05%.
- Report net profit
- USD45,491,981.17 from the simulated compounding run, not verified live income.
We retain the promotional image unchanged and disclose the differing report values rather than silently treating them as identical. The extraordinary compounded ending result depends on the simulation, sizing and historical model development; it should not become a target for a buyer’s account.
The developer describes rolling periods of approximately six months of training/optimization followed by six months of forward testing. We have not audited the raw training matrices or pipeline. That description does not establish that the entire displayed multi-year curve is unseen data, and historical price ticks do not independently validate future model performance.
The shorter test: claimed unseen data, still a simulation
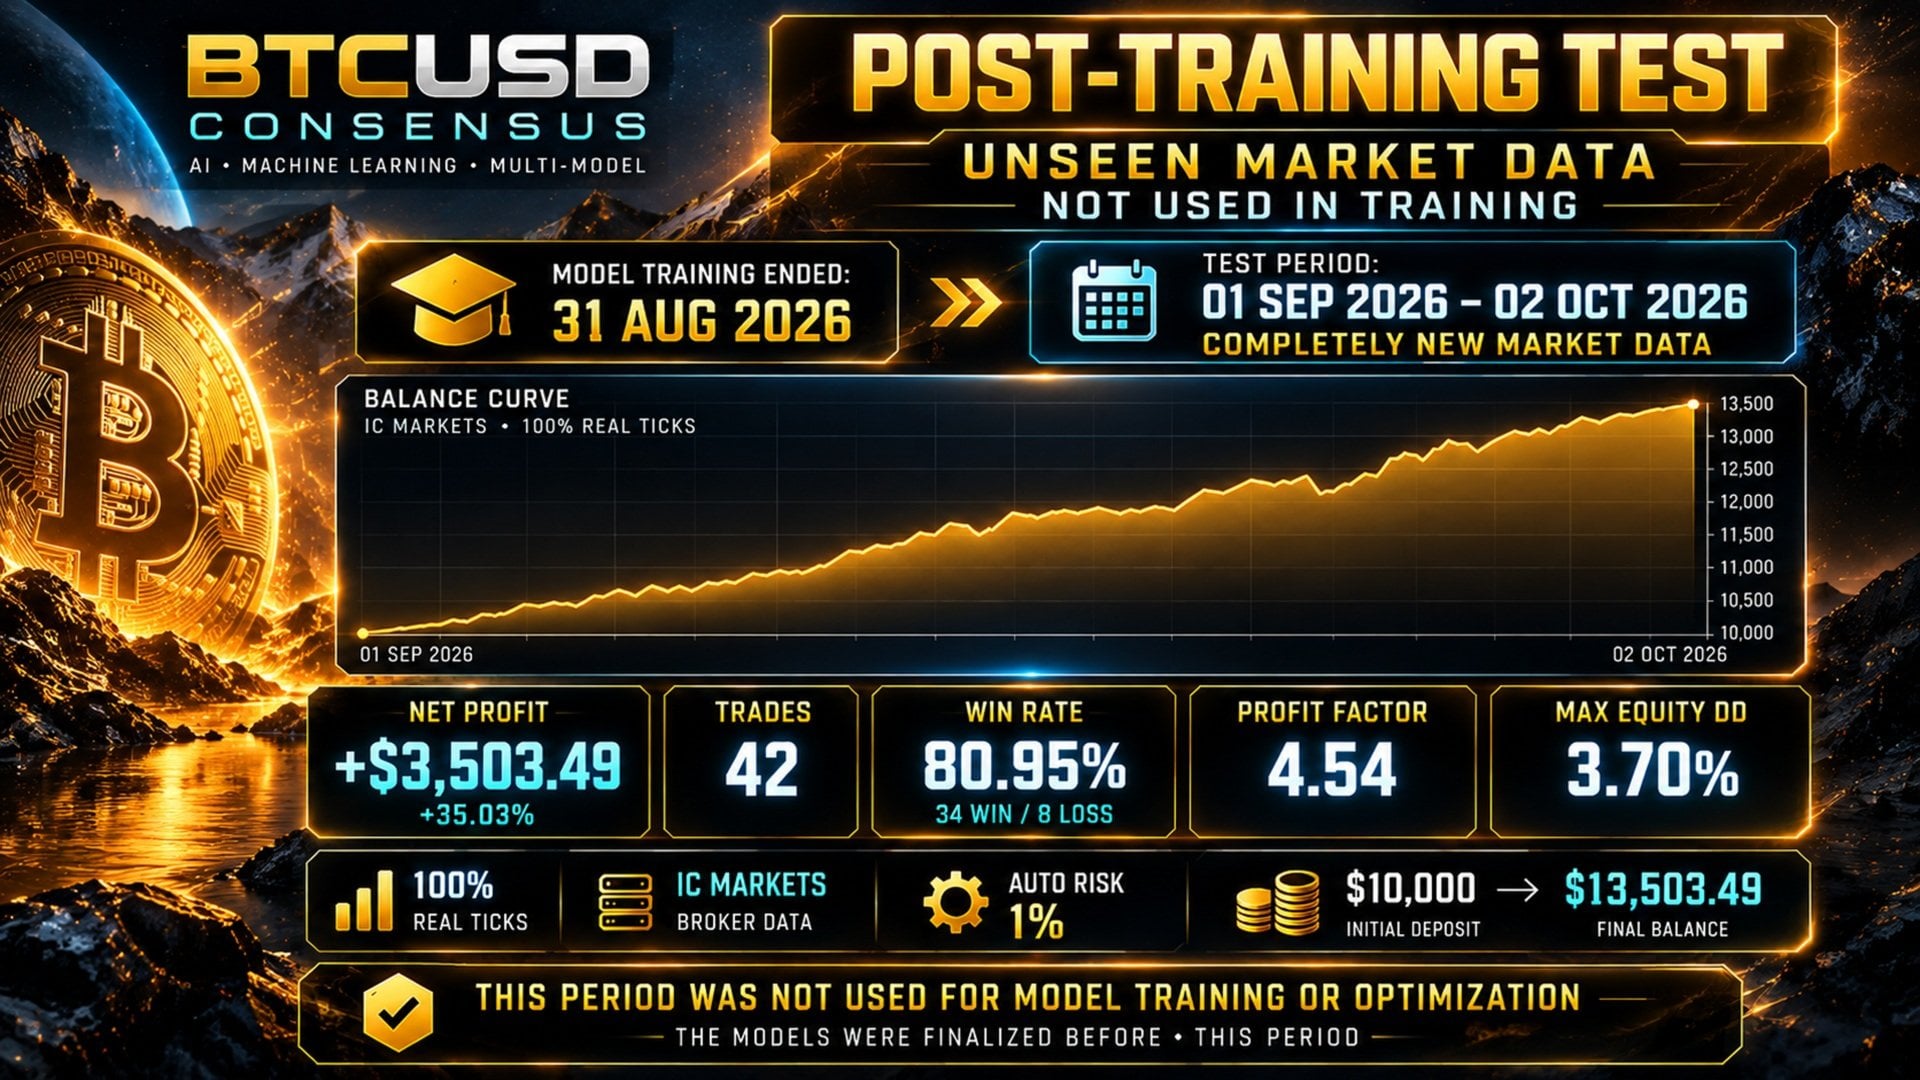
The developer says training ended August 31, 2026 and September 1–October 2 was excluded from training and optimization. The original shorter report ZIP confirms that testing date range and its reported outcomes. It does not independently establish how the training split was enforced.
From a USD10,000 starting deposit at 1:100 leverage, the report shows USD3,503.49 net profit, 42 trades, 34 winners and eight losers (80.95%), with profit factor 4.54. Relative equity drawdown is 3.70% and relative balance drawdown 2.93%. Average winning and losing trades are USD132.14 and USD123.66 respectively. The settings again enable 1% base Auto Risk with ×2 Recovery.
This roughly one-month, 42-trade test is more focused than the whole-period curve, but it remains developer historical testing. Its 35.03% period gain is not a promised monthly rate, and the lower win rate illustrates how sharply a smaller sample can differ from the long aggregate.
New MT5 monitoring account: October 6 evidence update
No BTCUSD Consensus signal was linked at our original October 5 check. On October 6, both edition listings linked Btcusd Consensus signal 2394509. It is a MetaTrader 5 account on ICMarketsSC-MT5-3, with 1:1000 leverage. Monitoring began October 6 at 14:52:13; the headline “3 weeks” refers to account age and must not be read as three weeks of monitored performance.
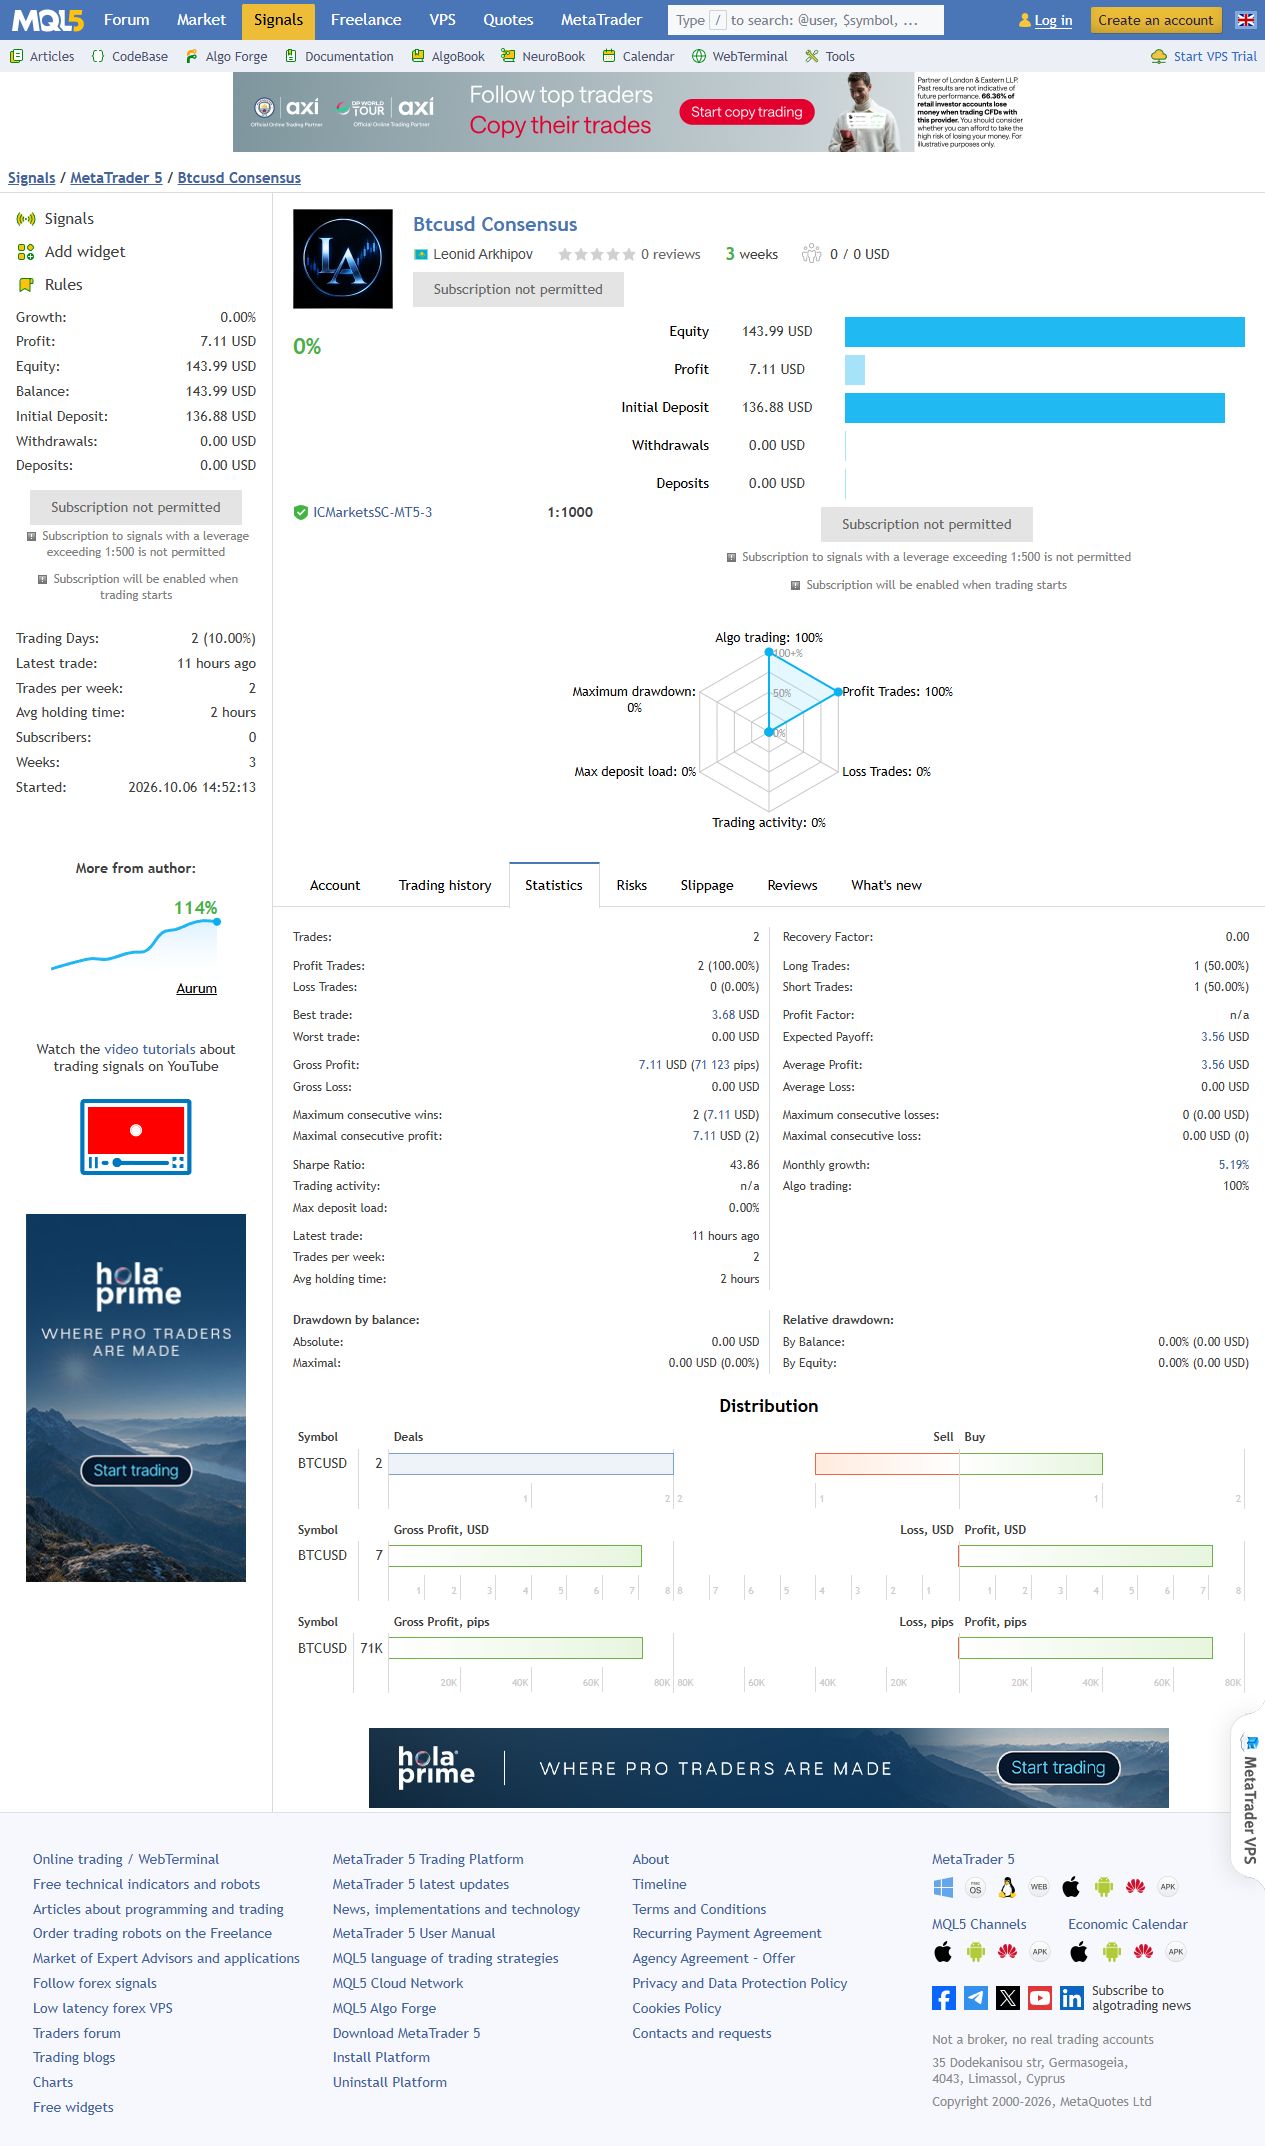
The capture shows two completed Bitcoin trades, both profitable, with USD 7.11 profit from a USD 136.88 initial deposit and USD 143.99 balance/equity. It reports zero drawdown and 100% wins, but a two-trade sample beginning monitoring that day is far too small to establish loss behavior or validate the historical backtests. Profit factor is unavailable because there are no losing trades. The overview displays 0.00% accumulated growth while the monthly statistic shows 5.19%; we retain the original display rather than treat these as interchangeable measures.
MQL5 does not permit subscription at the displayed leverage above 1:500. This new MT5 monitor is not an established MT4 track record. The seller’s Aurum signal belongs to a different EA, so its growth and drawdown are not Bitcoin evidence. There were still no public product reviews to capture as customer feedback at our October 6 check.
The October MT5 VPS fix
A public October 3 support exchange concerned the EA’s large file failing to migrate to MQL5 VPS. The developer reduced embedded graphic resources, and the buyer reported that synchronization was resolved. The version 1.65 release notes confirm the resource optimization and state that models, signals and trading parameters were unchanged. This is feedback about one technical fix, not profitability evidence or a guarantee for every VPS.
Other products from Leonid Arkhipov
Compare Ghost XAU EA MT5 and its shared edition review, or Aurum AI EA MT5 and the Aurum guide. For Forex majors, see GBP Machine Pro with its GBP review, and EUR Machine Pro with its EUR review. These are separate systems with different market exposure and evidence.
Is BTCUSD Consensus worth considering?
The strongest practical features are the documented model ensemble, visible execution gates and controlled number of positions. The public guide and original reports allow a closer inspection than a promotional curve alone. A sensible assessment still needs correct broker time, actual contract risk and an explicit decision about Recovery. The detailed defaults discussed here come from the MT5 guide; verify the MT4 build’s Inputs separately.
The current evidence supports studying the design and testing it under the intended broker’s conditions. The new two-trade MT5 monitor does not establish a mature live track record, and there is no separate established MT4 record. Neither justifies expecting the historical win rate and compounded gains to continue.
View BTCUSD Consensus EA MT5 pricing and product details View BTCUSD Consensus EA MT4 pricing and product details