
Nebula Cartographer AI EA MT5 trades XAUUSD gold on H1 by mapping market structure, Premium/Discount location and liquidity pools before a neural confidence filter qualifies an entry. Valentina Zhuchkova’s system combines this analysis with protective stops, automatic sizing, partial closes and trailing management. The developer describes ONNX model inference running inside MetaTrader 5.
Our assessment: the appeal is a visible market map and local model runtime for traders interested in context-based gold entries. The main considerations are undisclosed detailed model settings, an extremely young public signal and 39.41% relative equity drawdown in the higher-risk tester example. The available evidence supports an explanation of the design, not a reliable forecast of returns.
View Nebula Cartographer AI EA MT5 features and pricing

We checked the official MQL5 listing, original gallery, public comments and the directly linked Nebula Cartographer IC Markets signal on October 5, 2026. The listing was published October 4. We have not independently run the executable, reproduced its tests or audited its training pipeline. Original source images are dated and identified below; the main cover is separate CheaperForex promotional artwork.
Market structure and liquidity come before the entry
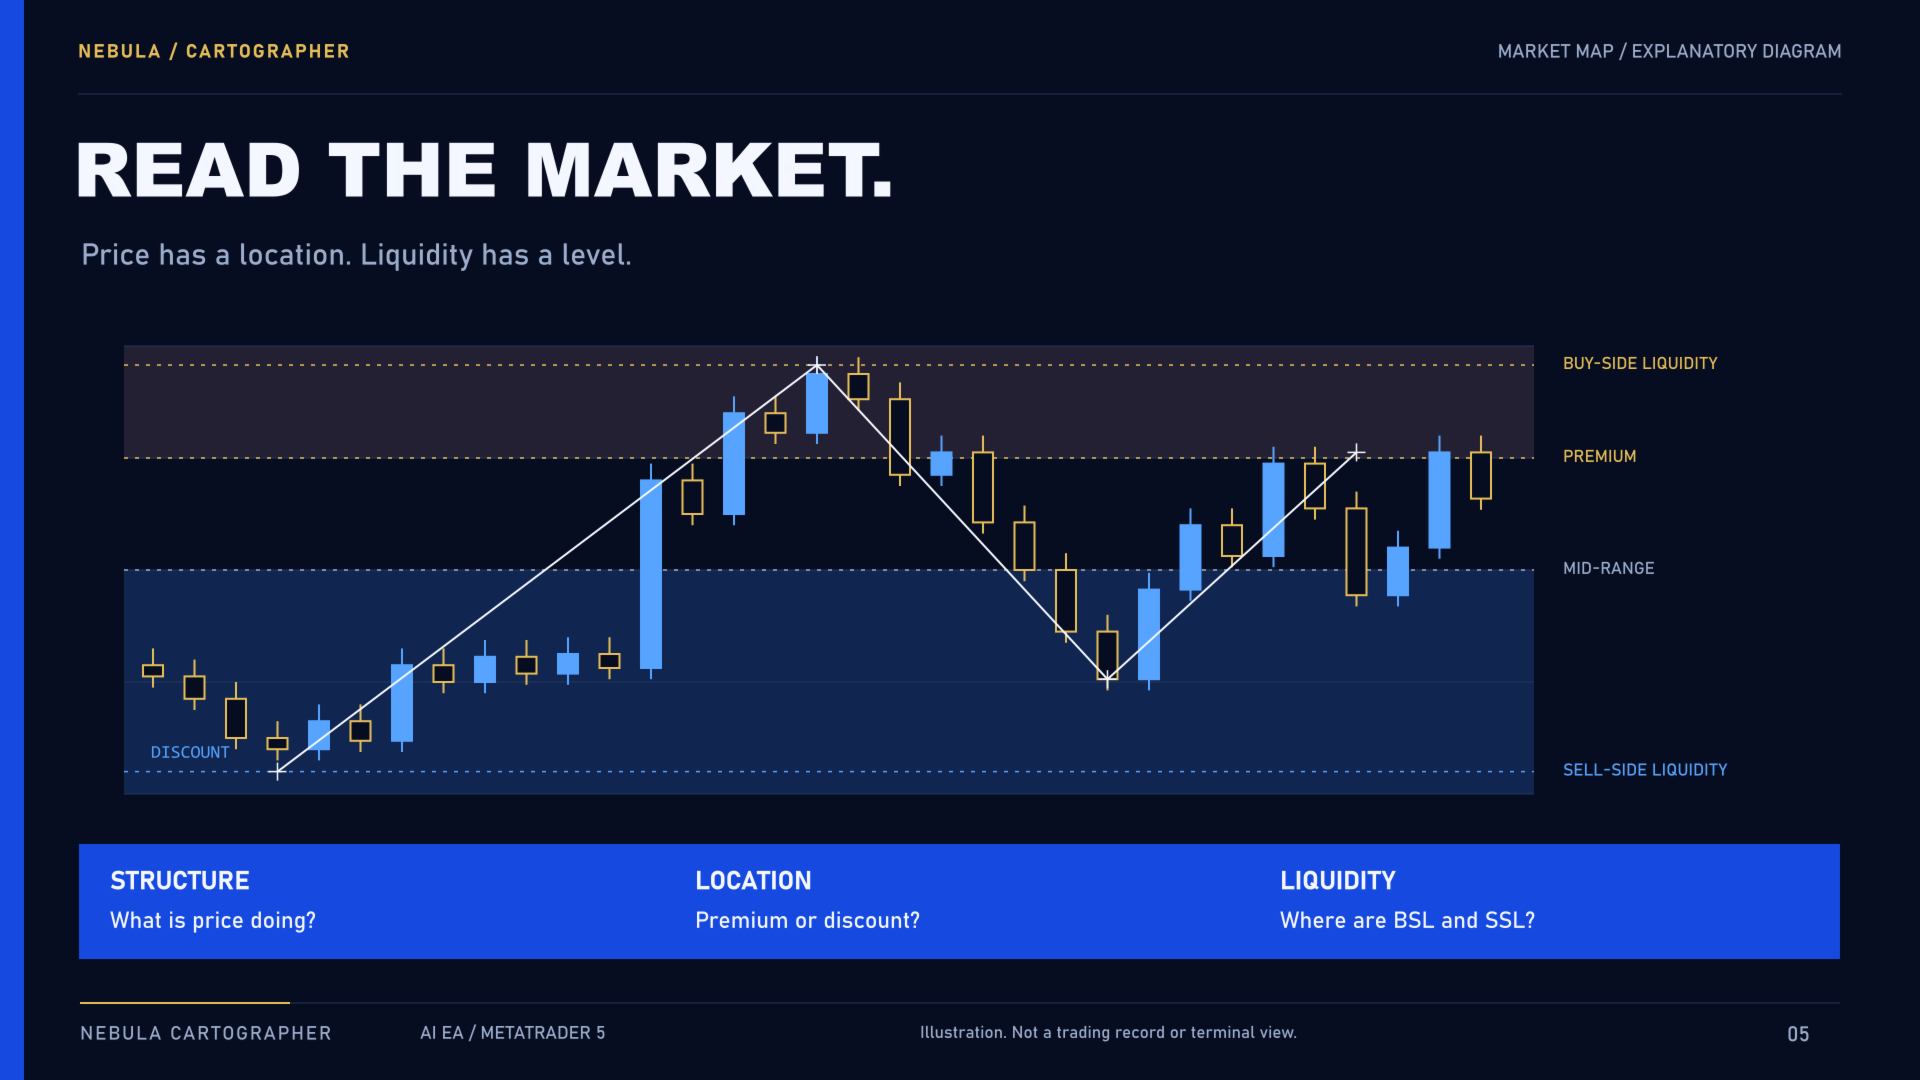
The developer’s sequence is to map the market, qualify a setup and then manage the position. Premium/Discount zones describe price location within the mapped structure. Buy-side and sell-side liquidity pools add context about levels the system considers relevant. This makes the proposed entry process more specific than a general claim that an EA “uses AI.”
It does not mean that a liquidity level must reverse price, or that buying a discount zone is automatically profitable. The public description does not disclose complete formulas, thresholds or a reproducible entry checklist. The diagram below explains the concept; it is not a terminal capture proving that an order was filled at the illustrated level.
Confidence filtering across changing market conditions
Trend, range, expansion and compression are the stated market contexts. Structure and liquidity information combines with ATR-based volatility, session and higher-timeframe context. A neural confidence threshold then determines whether a candidate setup qualifies; low-confidence opportunities are skipped.
The chart panel is described as displaying higher-timeframe bias, structure, liquidity levels and confidence. That can help a user inspect what the EA is considering. However, the developer has not publicly established that a score of a particular value equals the same percentage chance of winning. Selection quality needs separate testing; the score alone is not performance evidence.
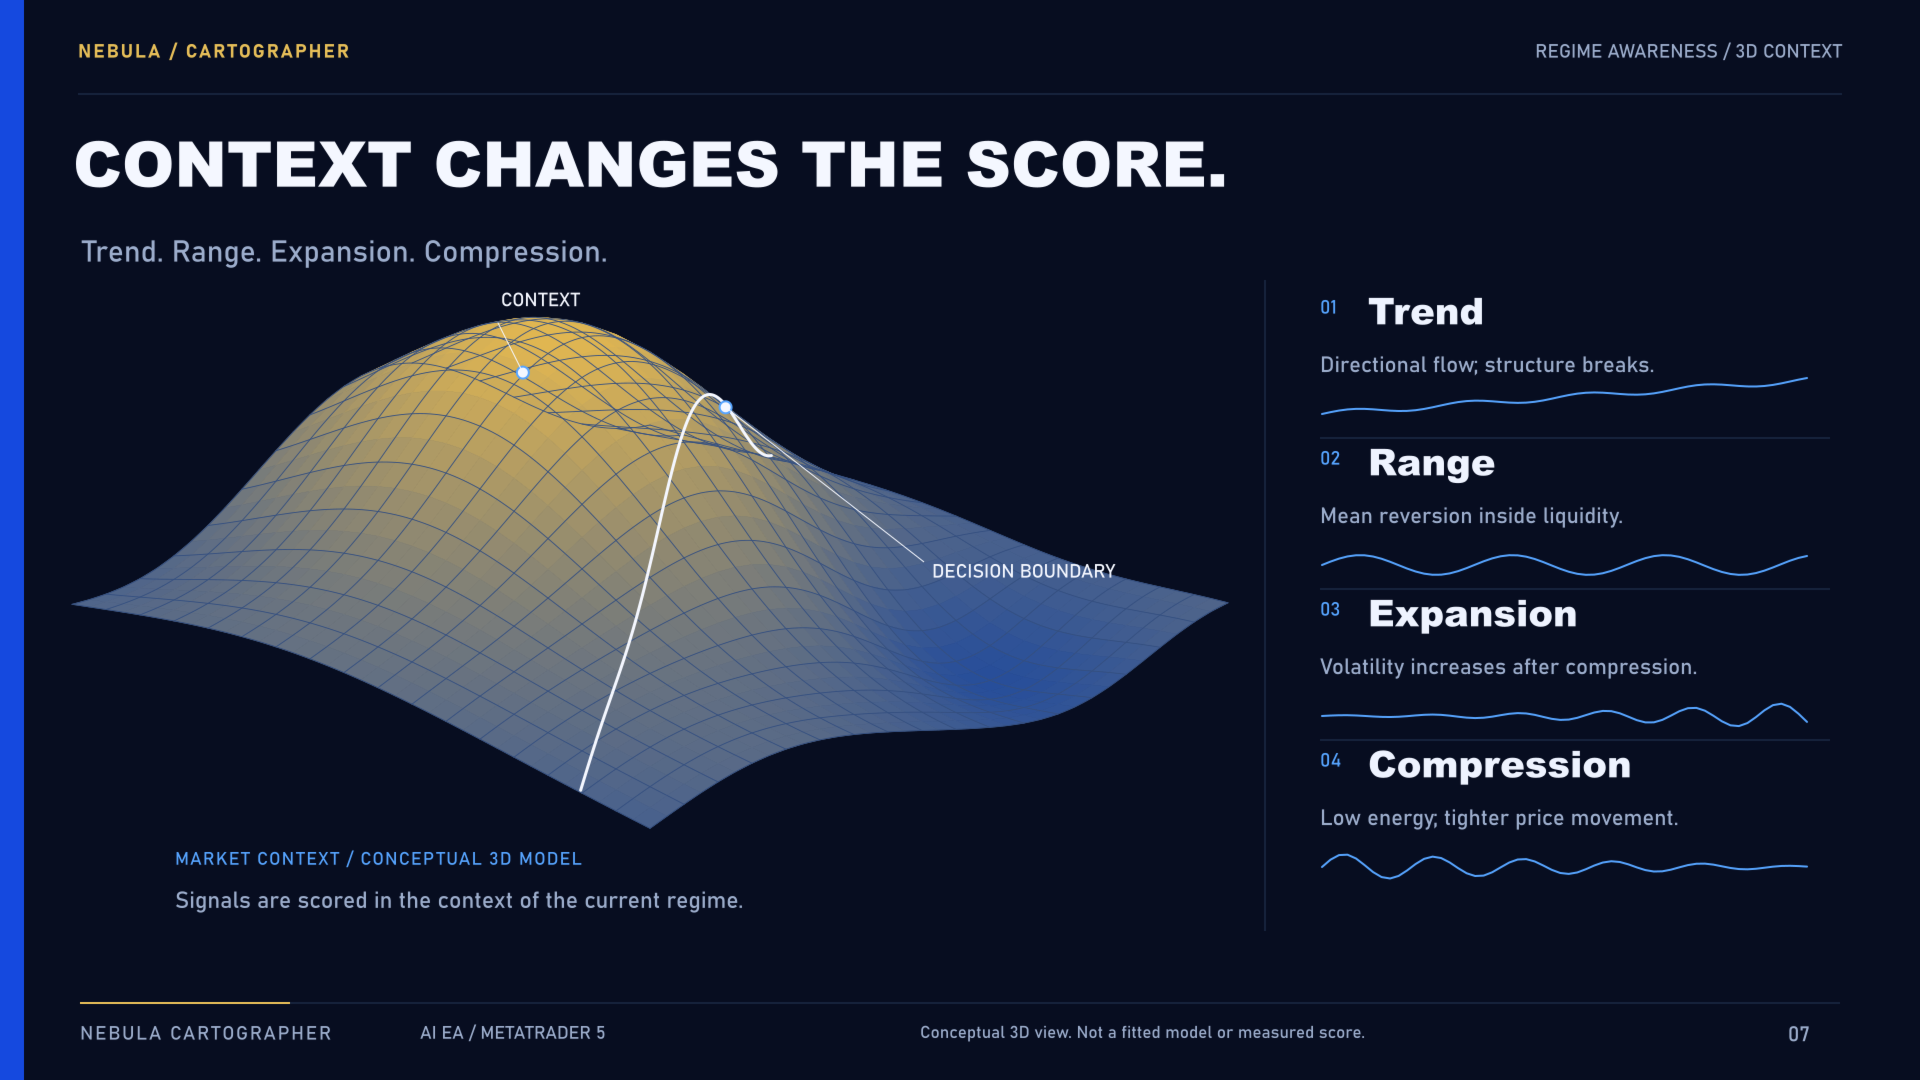
The original regime illustration expressly says it is not a fitted model or measured score. Its smooth surface helps explain the intended contextual approach but cannot reveal the actual trained decision boundary or prove predictive accuracy.
Offline training and ONNX inside MT5
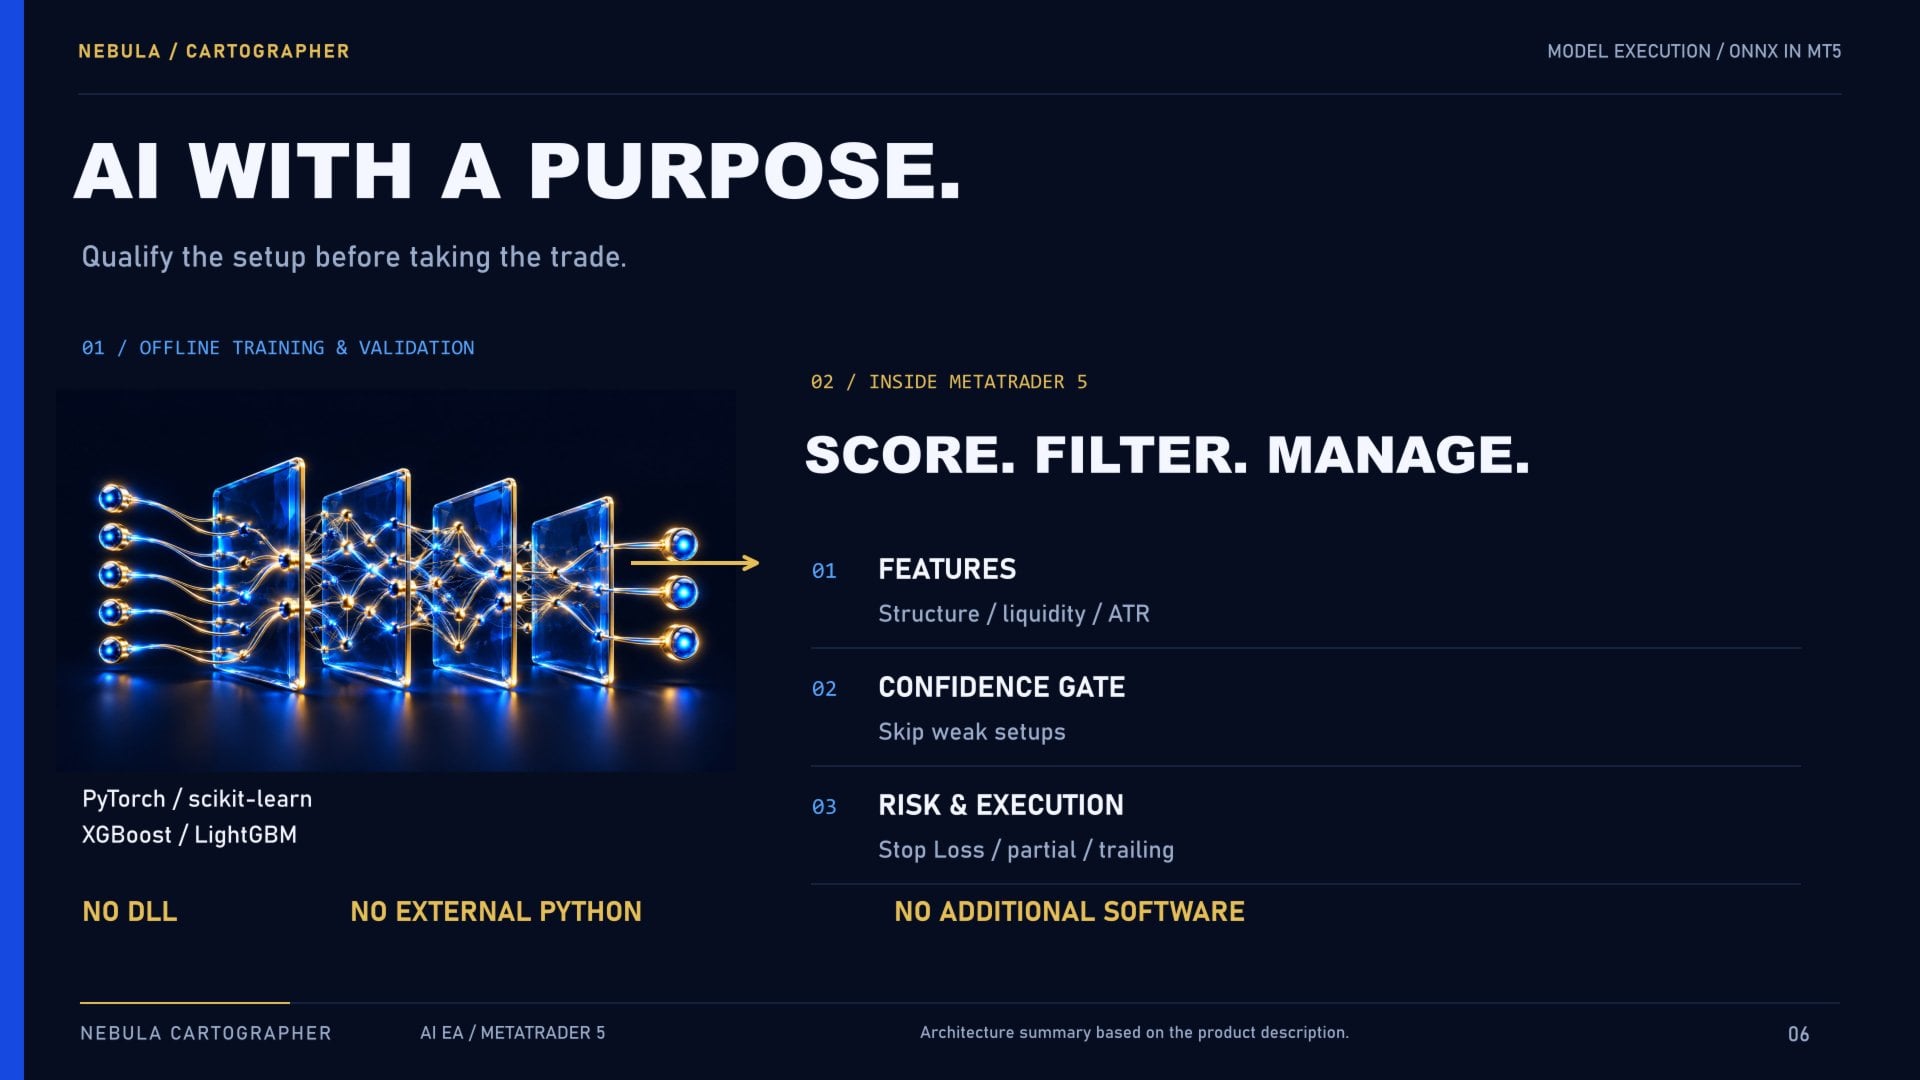
The listing describes offline training and validation using PyTorch, scikit-learn, XGBoost and LightGBM, with deployment through ONNX inside MT5. The developer says external Python, DLLs and additional software are not needed to run the model. For users, the practical attraction is that the described inference process runs locally within the trading terminal.
These are architecture claims from the developer. Listing training tools does not verify the model, establish its out-of-sample quality or demonstrate continuous self-learning. There is no public claim here that the installed EA automatically retrains itself on your account. Its trading connection and terminal still need to remain available.
Position management and setup considerations
- Market and chart
- XAUUSD on H1 in MetaTrader 5.
- Recommended execution
- IC Markets with a low-spread Raw/ECN account; a VPS is recommended for uninterrupted operation.
- Listed controls
- Protective stop loss, automatic position sizing, partial close, trailing stop and selectable risk profiles.
- Risk-profile guidance
- Begin with a low profile and assess the system on your broker before increasing exposure. Public labels do not define a fixed percentage or establish the supplied default.
A stop loss is a useful trade control, but gaps and slippage can produce a different realized loss. Broker lot steps, contract size, commissions and spreads also affect results. The public description does not establish a universal minimum deposit, leverage requirement or account-level loss cap. Nor does it confirm no-grid/no-martingale operation or a particular maximum number of simultaneous positions.
The “Prop Firm Ready” wording is conditional on configuring risk to the firm’s own rules and drawdown limits. It should not be treated as approval by every firm or a promise that a challenge will be passed. Evaluate the actual rules, exposure and broker behavior before relying on that claim.
Three developer backtests, with different periods and risk labels
The gallery includes three original tester composites for XAUUSD H1 at IC Markets, each showing an initial deposit of 10,000.00. Their simulated profit figures are striking, but the public listing does not link full reproducible reports, setfiles, training/validation dates or a separately identified out-of-sample test. We therefore report what the images show without treating their outcomes as verified live performance.
2016–2026, labeled Risk 3
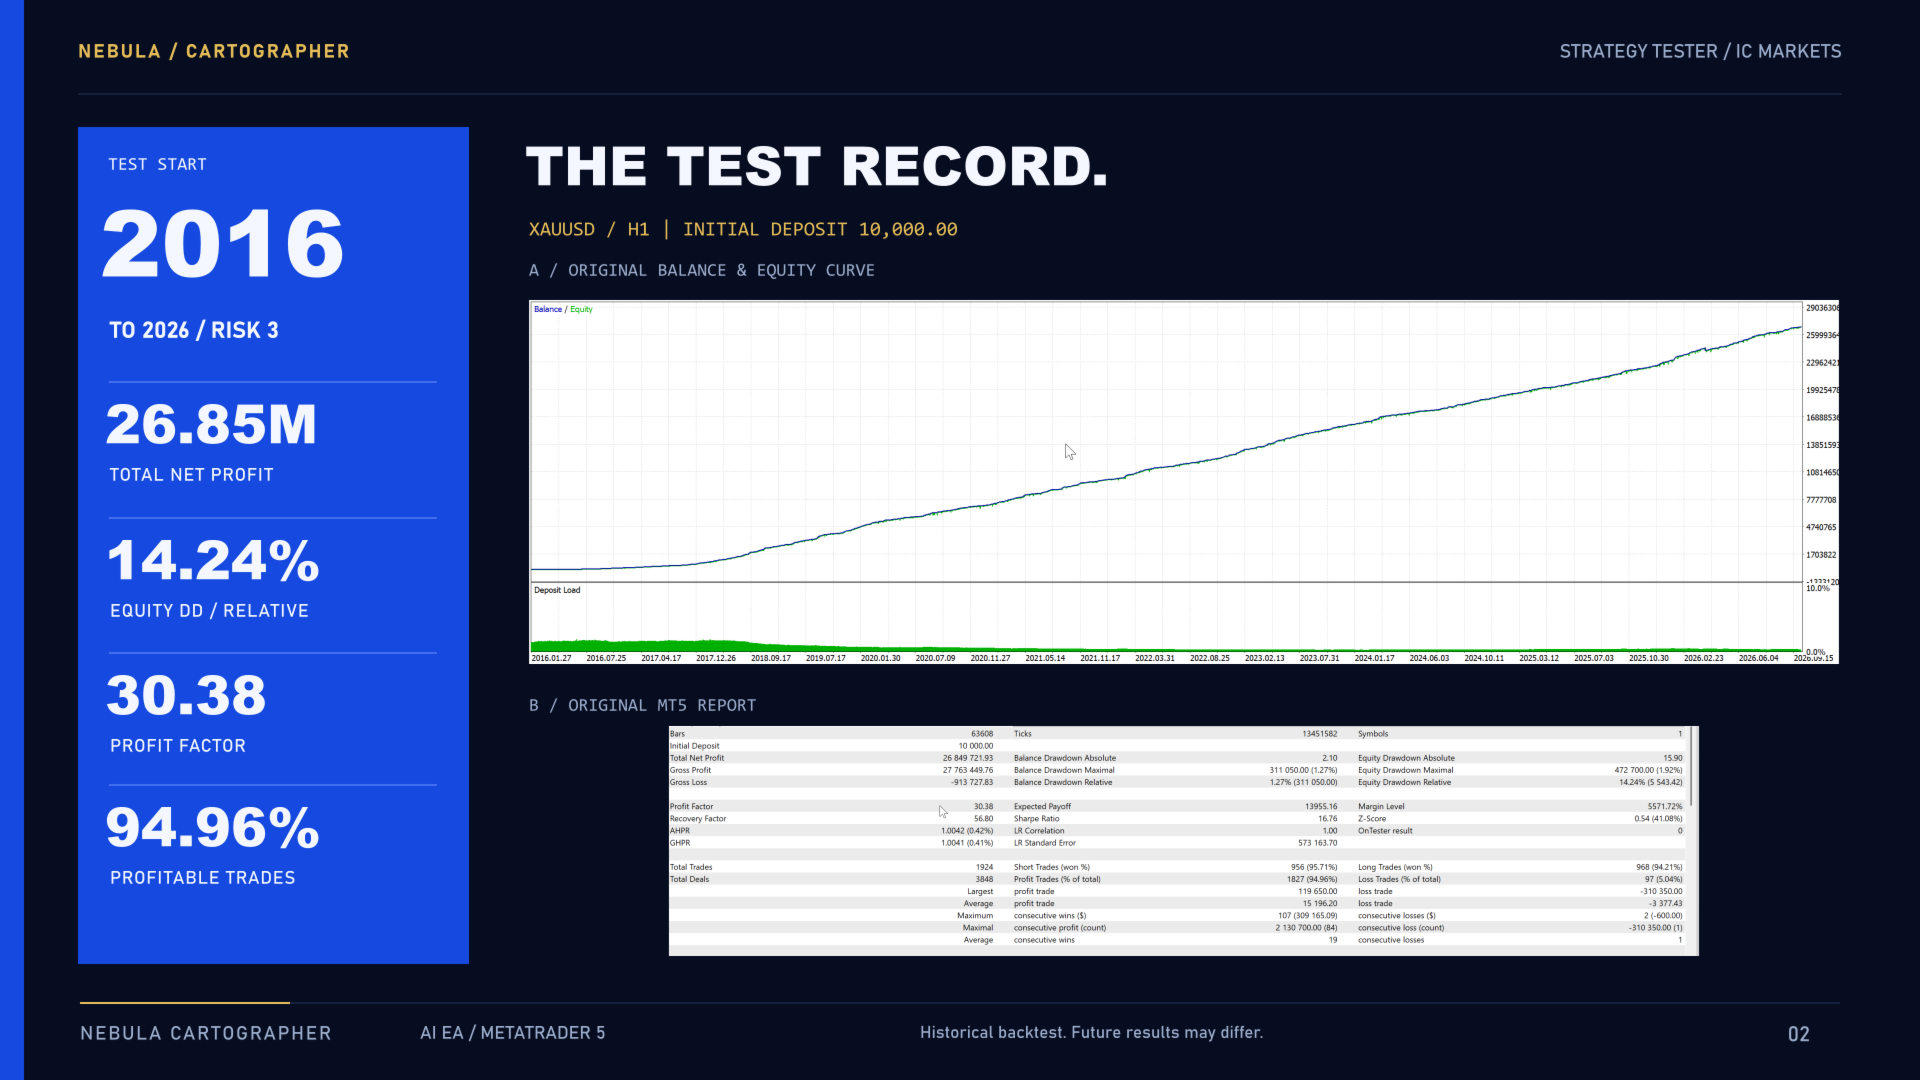
This plate reports approximately 26.85 million net profit, profit factor 30.38, 1,924 trades, 94.96% profitable trades and 14.24% relative equity drawdown. The displayed curve runs to approximately September 2026. The long historical span is not ten years of public live trading; the retail listing was published in October 2026.
2020–2026, labeled Risk 3
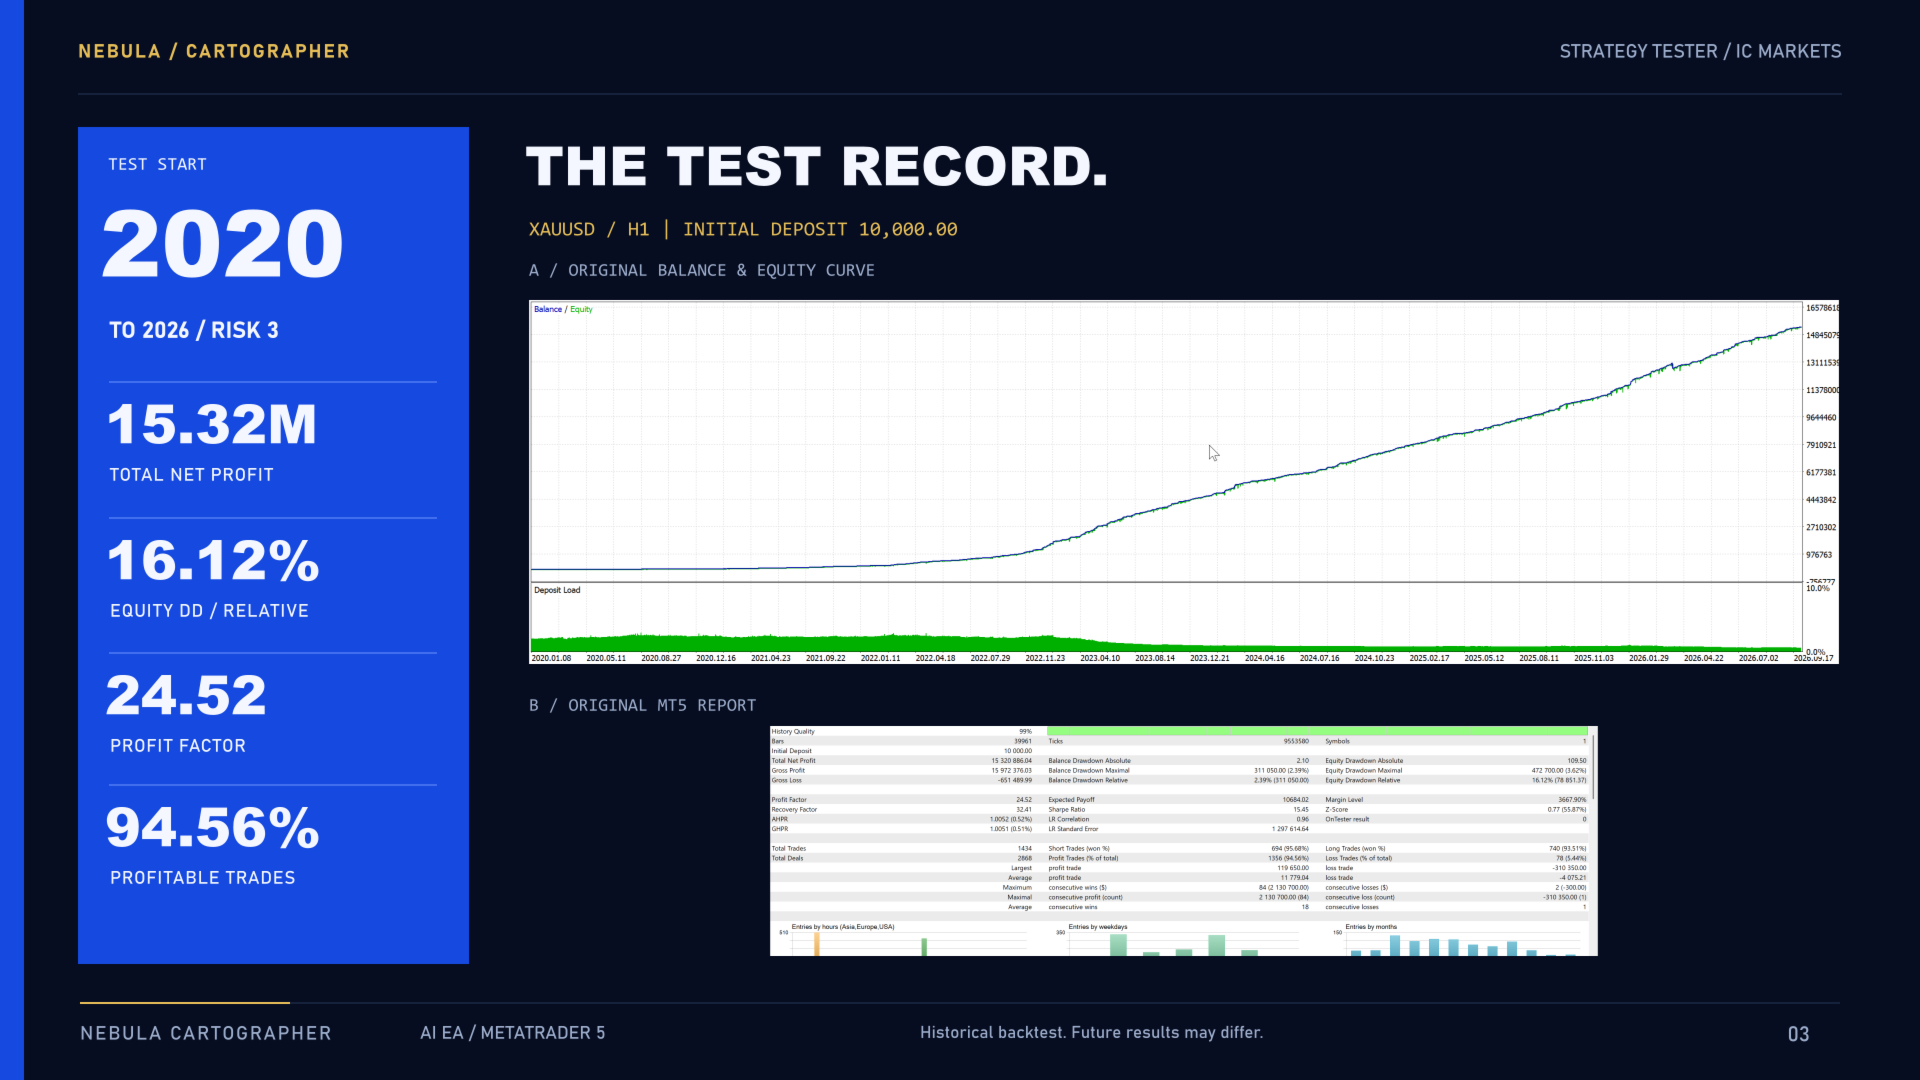
The shorter Risk 3 plate reports approximately 15.32 million net profit, profit factor 24.52, 1,434 trades, 94.56% profitable trades and 16.12% relative equity drawdown. Its 99% history-quality label concerns the tester’s historical data, not a 99% prediction accuracy or independent verification of the strategy.
2025–2026, labeled Risk 4
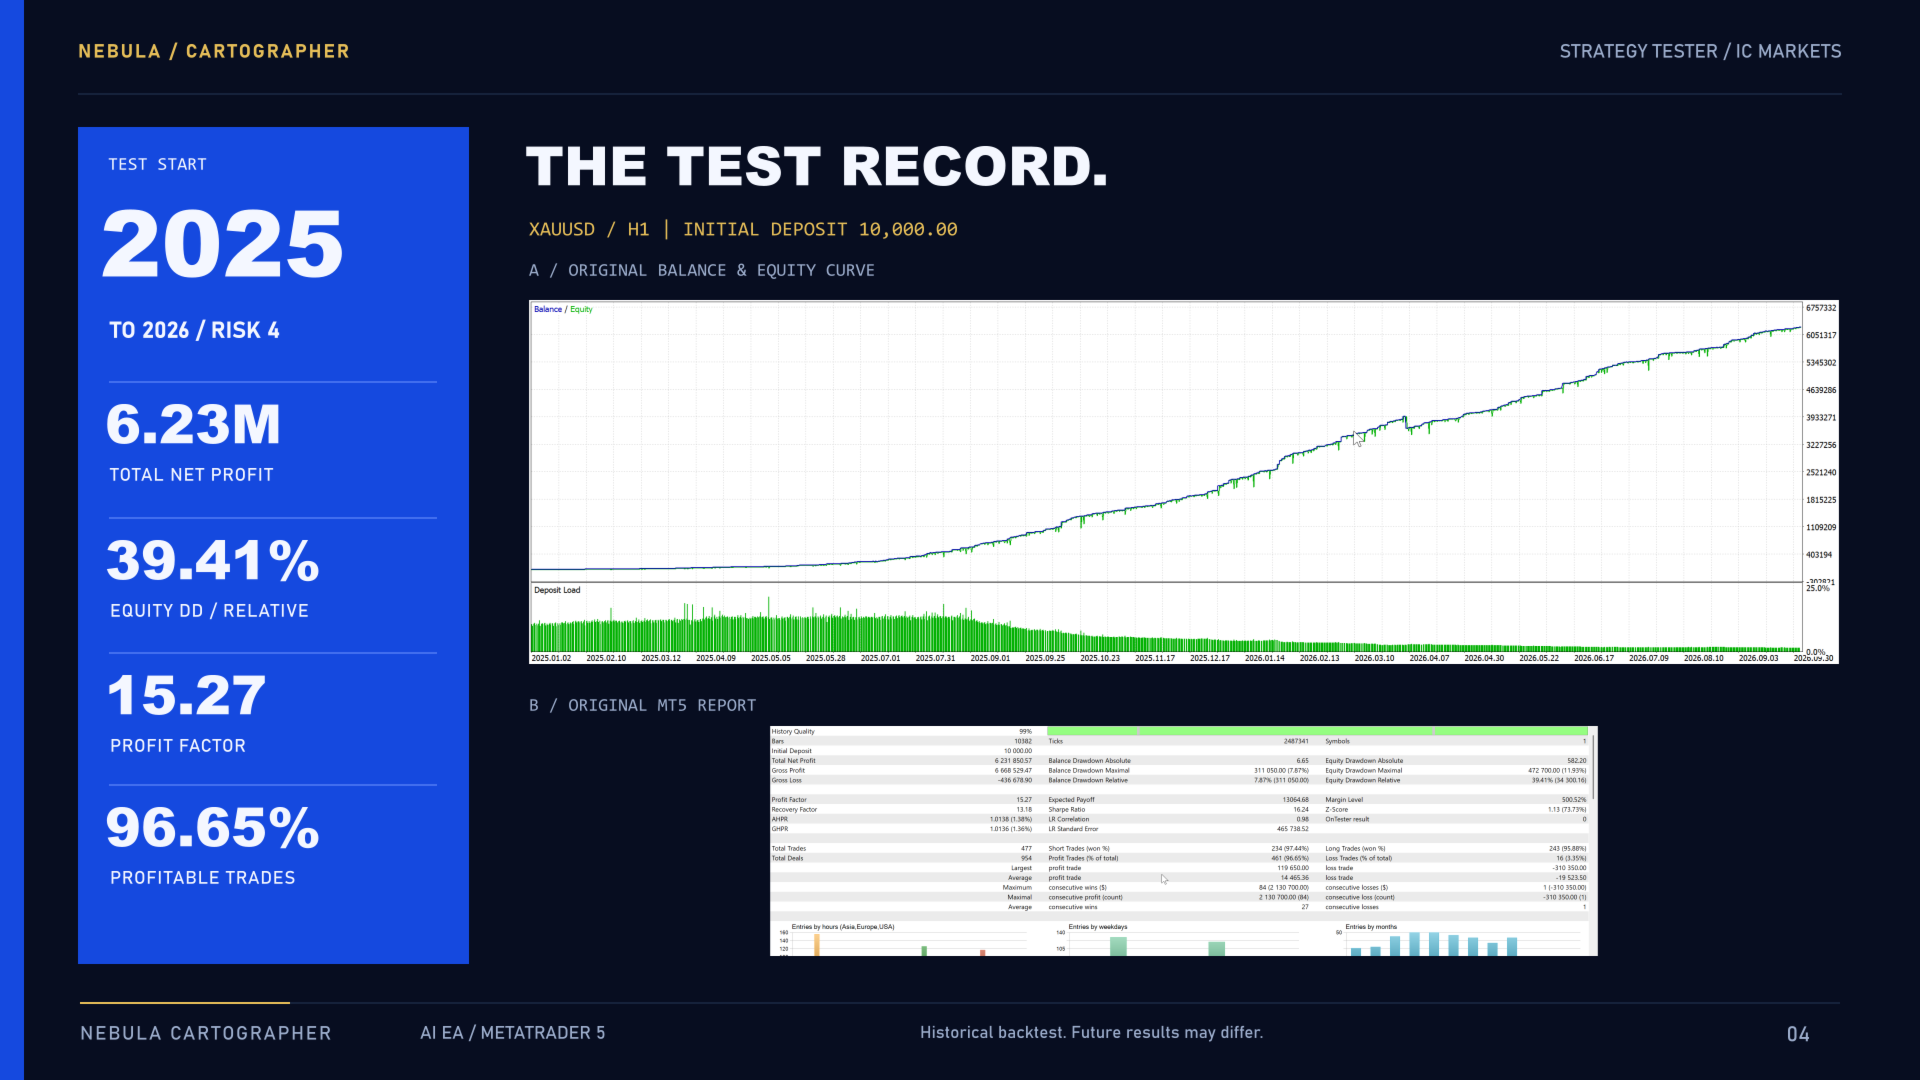
This example reports approximately 6.23 million net profit, profit factor 15.27, 477 trades and 96.65% profitable trades, alongside 39.41% relative equity drawdown. That drawdown is substantial despite the high win rate. The profile label is not evidence of precisely 4% risk per trade or a recommended default.
Changing both the test period and the risk label prevents a controlled comparison of profile effects. The large compounded profits also cannot establish what an individual account should earn. Complete settings, tick provenance, transaction-cost assumptions and the separation between training and validation would be needed to reproduce and assess these simulations. A past drawdown figure is not a ceiling on future losses.
The IC Markets signal: ten trades and conflicting growth fields
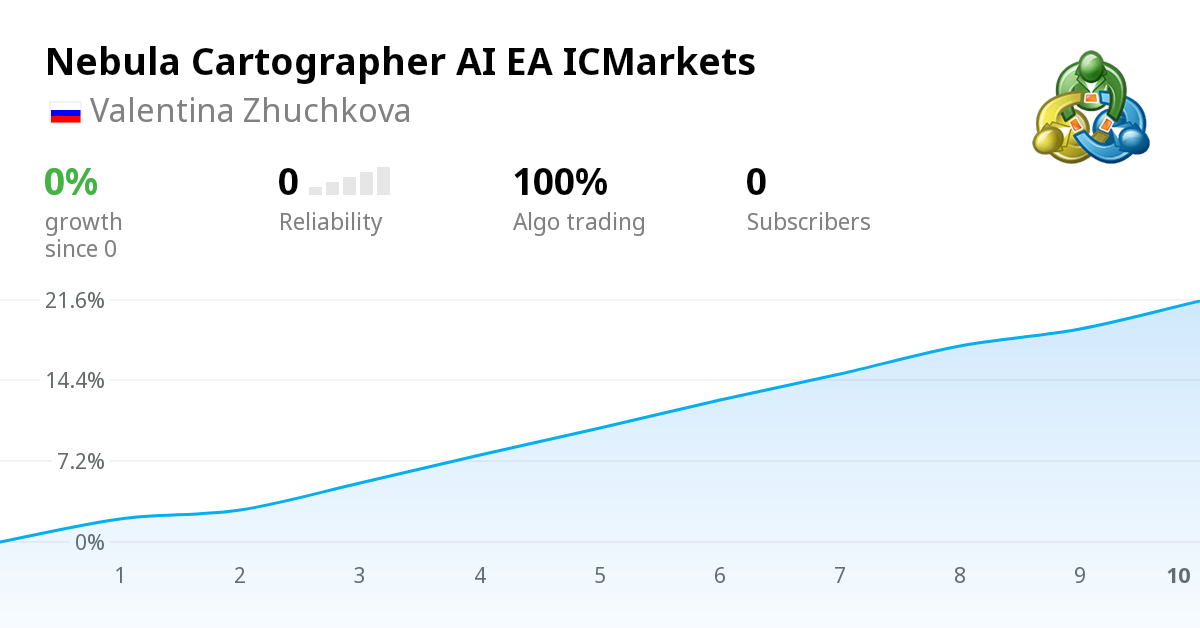
At our October 5 check, the signal page was labeled Real Account, with broker ICMarketsSC-MT5-3 and leverage 1:400. Those are MQL5’s account fields, not our independent audit of deposits, the executable or risk settings. The original image above is MQL5’s official share preview; its horizontal axis counts trades, not months.
- Growth fields
- Headline growth 0.00%; a separate monthly-growth field reported 21.49%.
- Cash fields
- Initial deposit 100.00 USD, profit 21.49 USD, balance and equity both 121.49 USD; additional deposits and withdrawals both zero.
- Sample
- Ten XAUUSD trades, ten profitable trades, 100% algo trading and reported profit factor 23.39.
- Public monitoring
- Started October 2, 2026 at 14:40:03. The page also showed a “3 weeks” history label and latest trade “4 days ago.”
- Drawdown fields
- Relative balance and equity drawdown both 0.00%; absolute balance drawdown 0.04 USD and maximal balance drawdown 0.11 USD (0.11%).
The zero headline growth conflicts with the monthly and cash fields. We preserve the source values rather than replacing the headline with a calculated return. Similarly, zero relative drawdown does not prove loss-free behavior when the same page reports a small maximal balance drawdown. These are different measures.
Only about three days of public monitoring had elapsed. The history label and latest-trade timing show that account history predates the listing; they do not establish three weeks of uninterrupted public monitoring or prove all ten trades used the current retail build. MQL5 warned on October 2 that the account was new and there were too few deals to assess trading quality.
Ten profitable trades cannot establish a reliable loss distribution or future drawdown. Profit factor is especially unstable in such a small sample. The page had zero subscribers and said signal subscription was not yet permitted; that state concerns the signal service, not whether the EA can be purchased. More monitored trading and reconciled fields would make the evidence more useful.
Customer feedback and documentation
The product had no customer reviews at the October 5 check. Its single public comment was the developer’s launch announcement, so it is not independent customer feedback. There is no testimonial capture to present, and we do not transfer the author’s other-product ratings to this EA.
No Nebula-specific public manual, preset or complete tester archive was linked. The available illustrations help explain the design, but exact setup and reproducibility detail remain limited. Developer gift promotions and support-community references on MQL5 should not be read as extra entitlements included with this CheaperForex offer.
Compare her other MT5 products
For separate alternatives, see Atherion Zenith EA MT5 and its Atherion Zenith review, The Silent Investor EA MT5 and its Silent Investor review, or Umbra Vault AI EA MT5 and its Umbra Vault review. Shared authorship does not establish identical features, settings or performance. Their signals cannot fill the gaps in Nebula’s short record.
Who should consider Nebula Cartographer?
The system is most relevant to traders who want gold H1 setup context, selective model qualification and automated trade management, and are prepared to test the risk profiles on their own broker. Its local-runtime description and original explanatory images make the concept inspectable. A longer public record and more reproducible testing would be needed before drawing a strong performance conclusion. Keep the higher-risk tester drawdown and the young signal in view when deciding on exposure.