
The Silent Investor EA trades gold through a structural breakout engine, an M15 volatility engine and a local-reaction scalper. The appeal is one-chart strategy variety with explicit position and equity controls. The main limitation is evidence: this is a new retail listing with a very short monitored signal and inconsistencies in its historical performance material.
Our view: a candidate for careful demo evaluation by traders who want configurable gold automation, but the public record does not yet support treating it as an established low-drawdown system.
View product details and current pricing.

- Official listing: The Silent Investor EA on MQL5
- Public account: The Silent Investor EA Adapt OFF — MT5 account
Research date: 14 September 2026. This review examines the public listing, linked guide, original gallery and MQL5 signal. We have not independently run the EA or reproduced the developer’s backtests.
How the three engines work
The structural component uses H8/M30 fractal levels for breakout context and pending stop entries. The second component looks at M15 range expansion relative to volatility. The third follows local extremes and exhaustion for shorter reactions. Those distinctions are more useful than a generic claim that three engines automatically make a portfolio diversified.
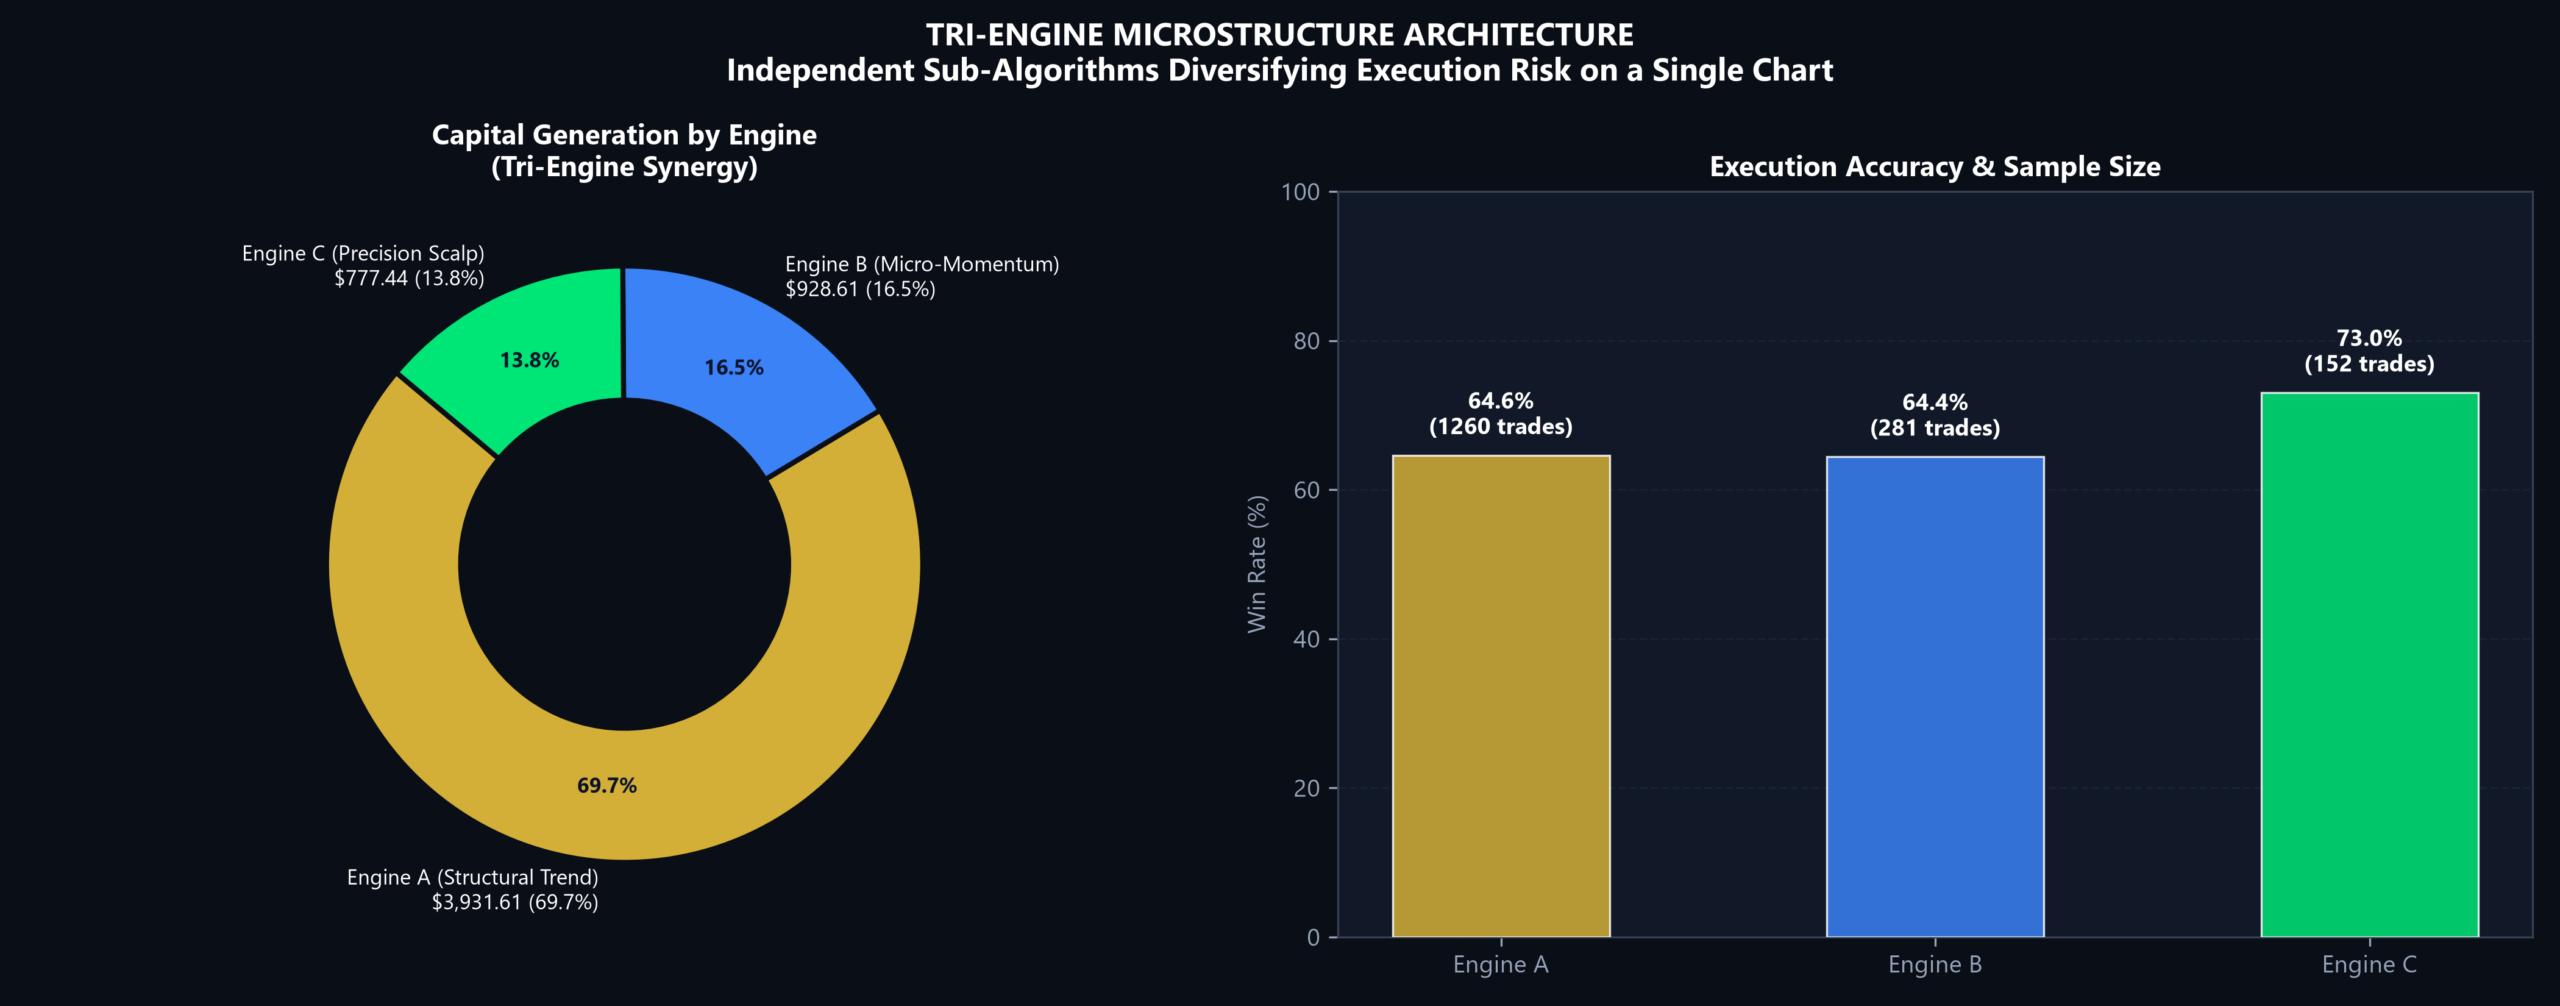
The guide attributes most historical profit to the structural engine. These are retrospective shares, not a promise about future contributions. All three trade XAUUSD, so a gold shock, wider spread or execution problem can affect the whole portfolio.
Live signal: promising growth, limited observation
- Public account
- The Silent Investor EA Adapt OFF; MQL5 labels it a real MT5 account on VantageMarkets-Live 19, leverage 1:500.
- Growth and trade count
- 113.49% growth; 34 trades; 26 profitable and 8 losing.
- Money amounts
- $176.30 initial deposit; $200.08 profit; balance and equity both $376.38 at capture.
- Drawdown
- 10.80% by balance ($45.57); 3.68% by equity ($14.40), reported separately.
- History versus monitoring
- Eight weeks of account history; signal started 11 September 2026 at 11:37:51. The listing was published 12 September.
- Trading statistics
- Profit factor 2.58; average win $12.56 versus average loss $15.80; all 34 trades were on XAUUSD+.
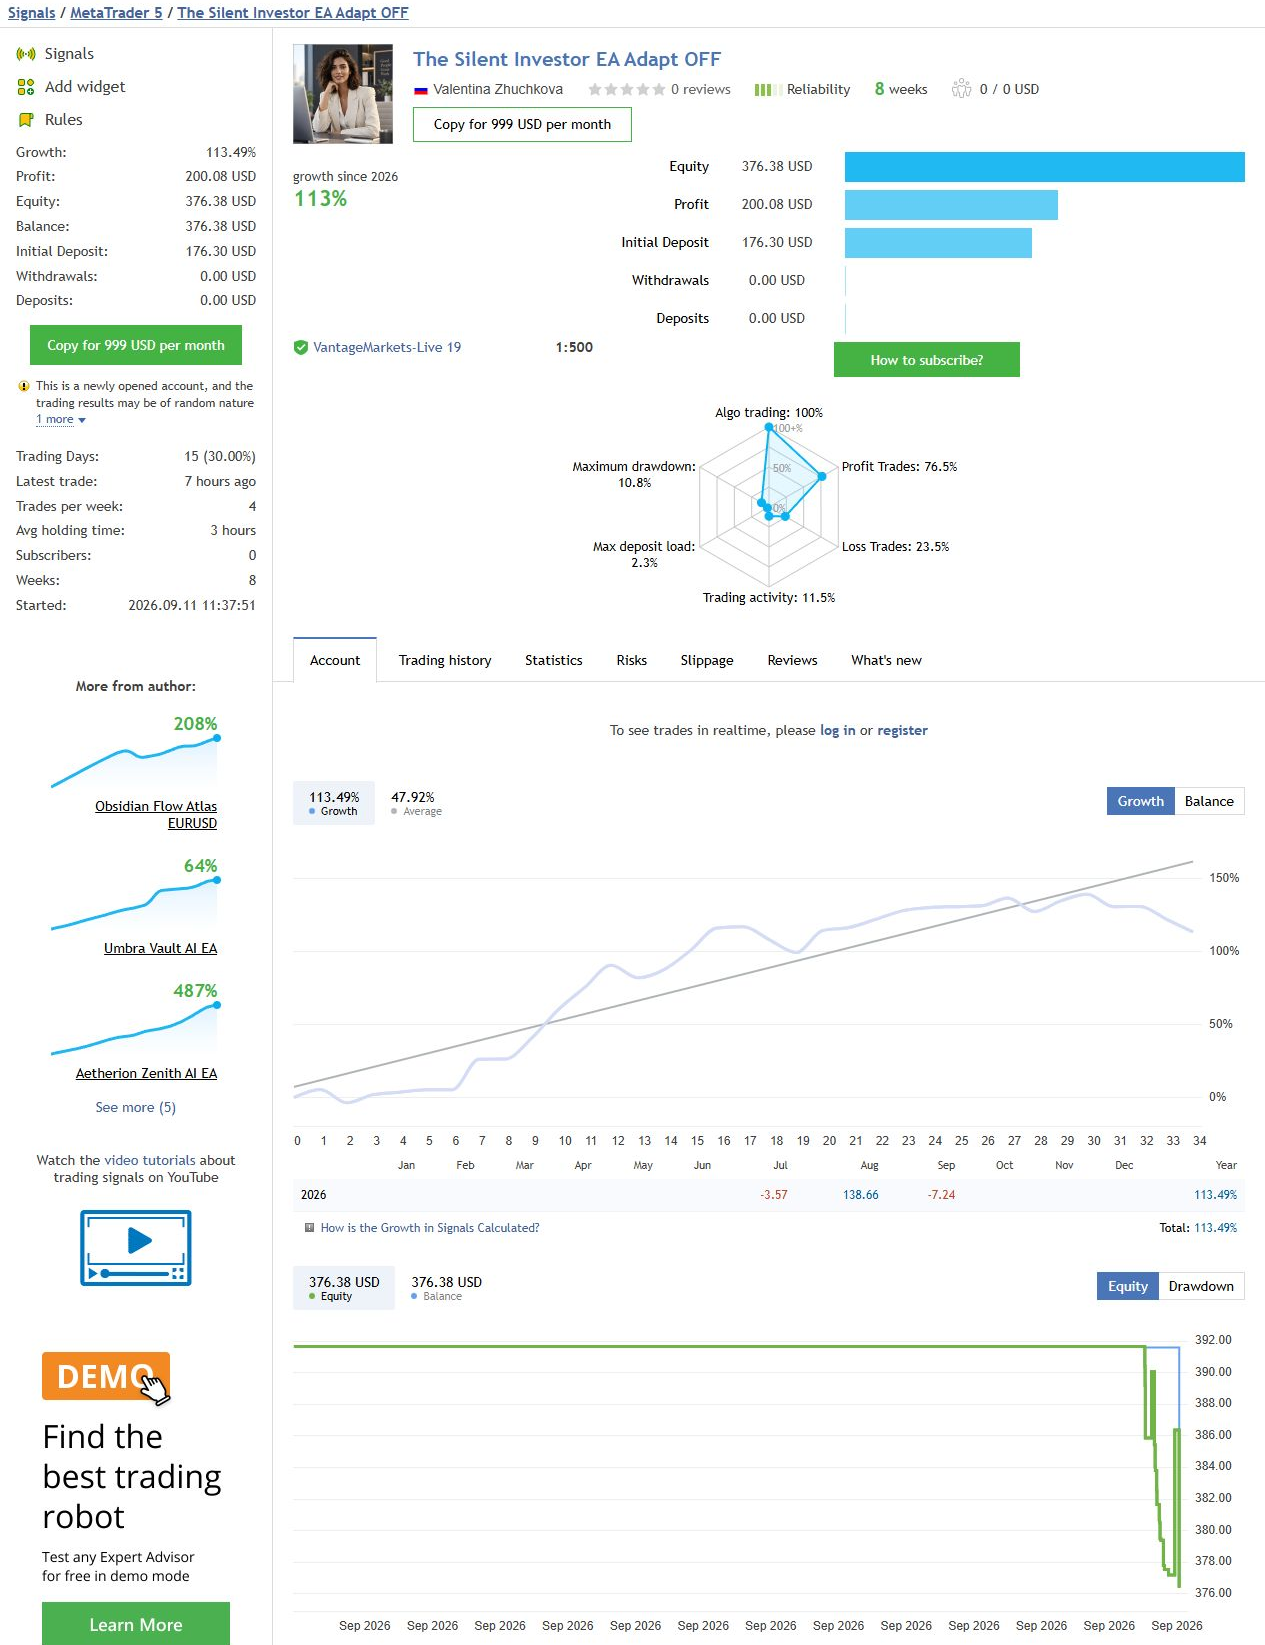
The account is in profit and offers a public trading record to follow. However, the monthly breakdown is uneven: July −3.57%, August +138.66%, and September −7.24% at capture. Most growth came before the signal’s monitoring start. MQL5 also warns that the account is newly opened and its results may be random.
The lower equity-drawdown number is especially easy to overread. The equity curve covers the recent monitoring window, while closed-trade history reaches further back. We would not use 3.68% as evidence that floating losses stayed below that level throughout all eight weeks. Nor should the account’s “Adapt OFF” results validate the adaptive preset automatically.
This is a small account with high leverage and only 34 trades. The headline growth is an encouraging observation, not enough to establish durability across market regimes. Check the current signal and its risk statistics before drawing conclusions from this dated snapshot.
Historical charts: two very different sizing models
The developer describes IC Markets Global real-tick testing from 26 January 2016 to 1 September 2026, including spreads, commissions and simulated slippage. These are developer-supplied simulations, despite the word “audit” in the artwork; no independent reproduction was available for this review.
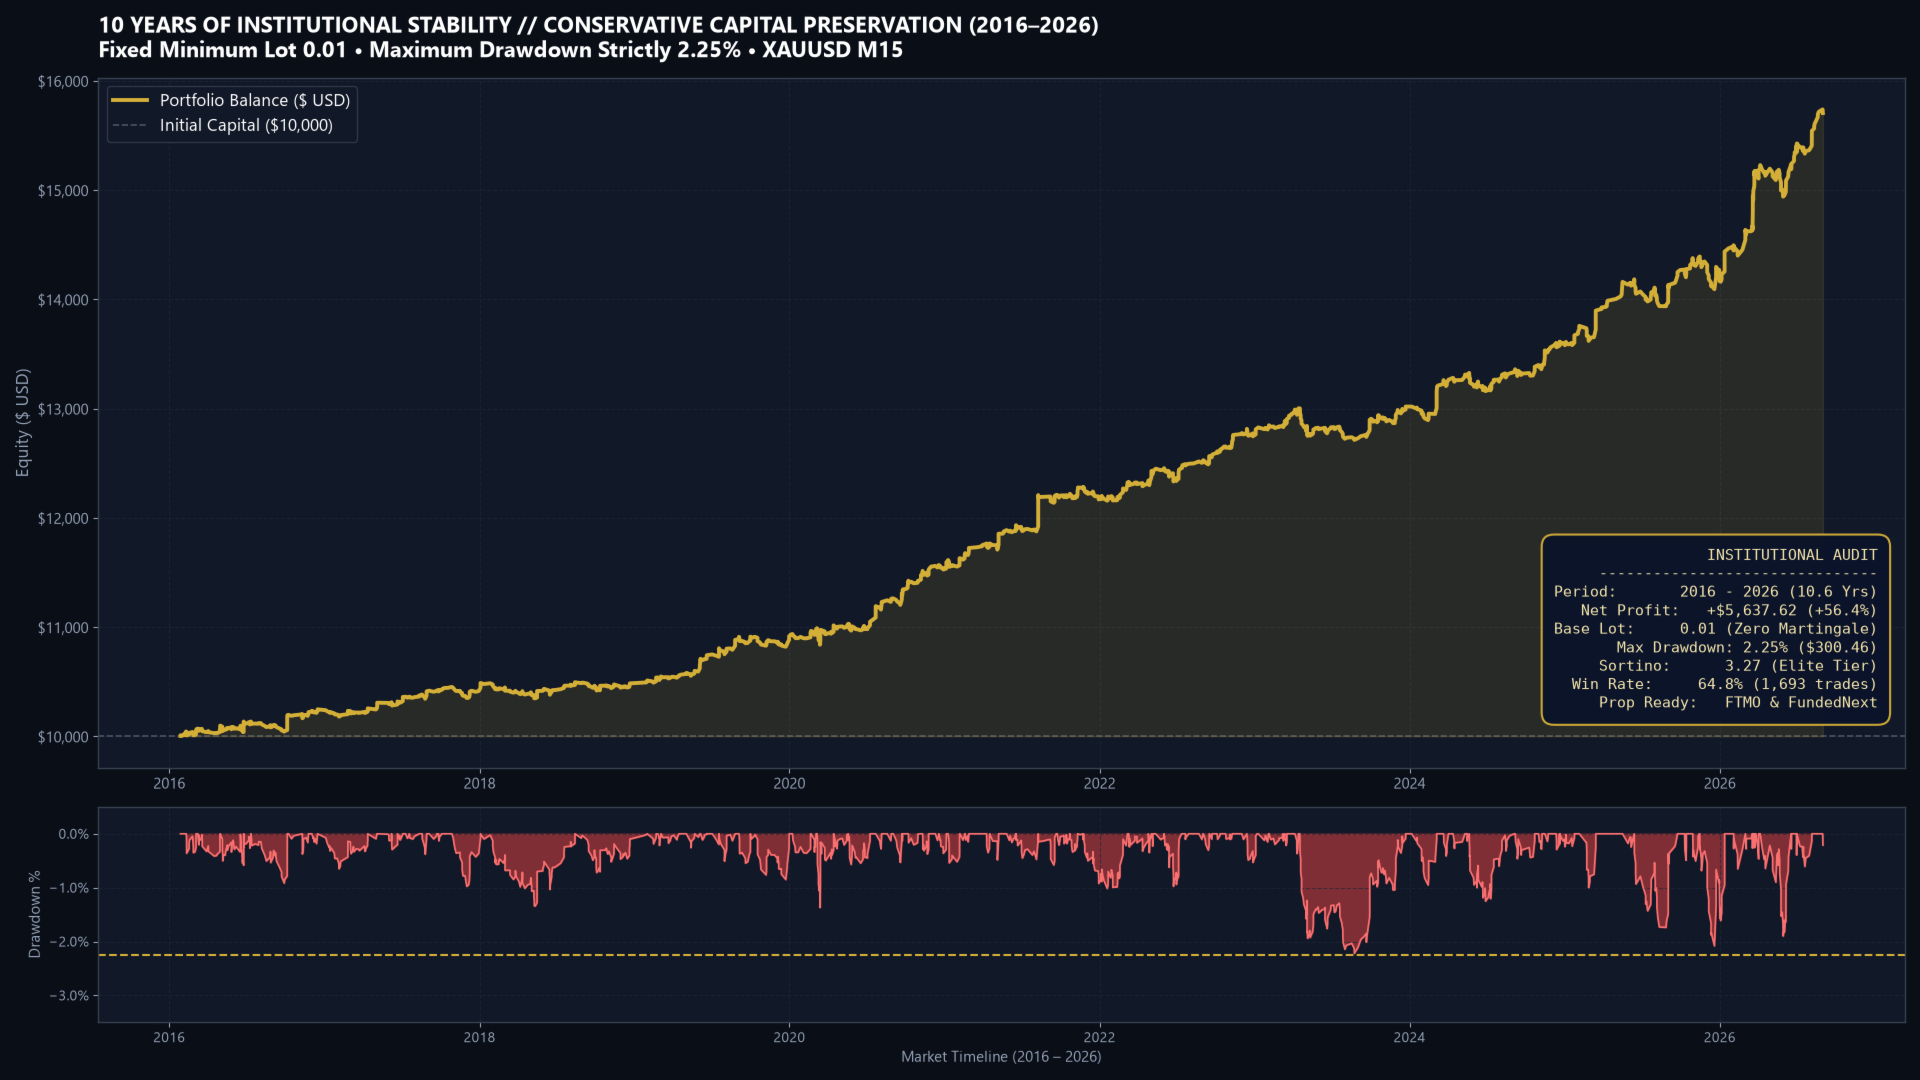
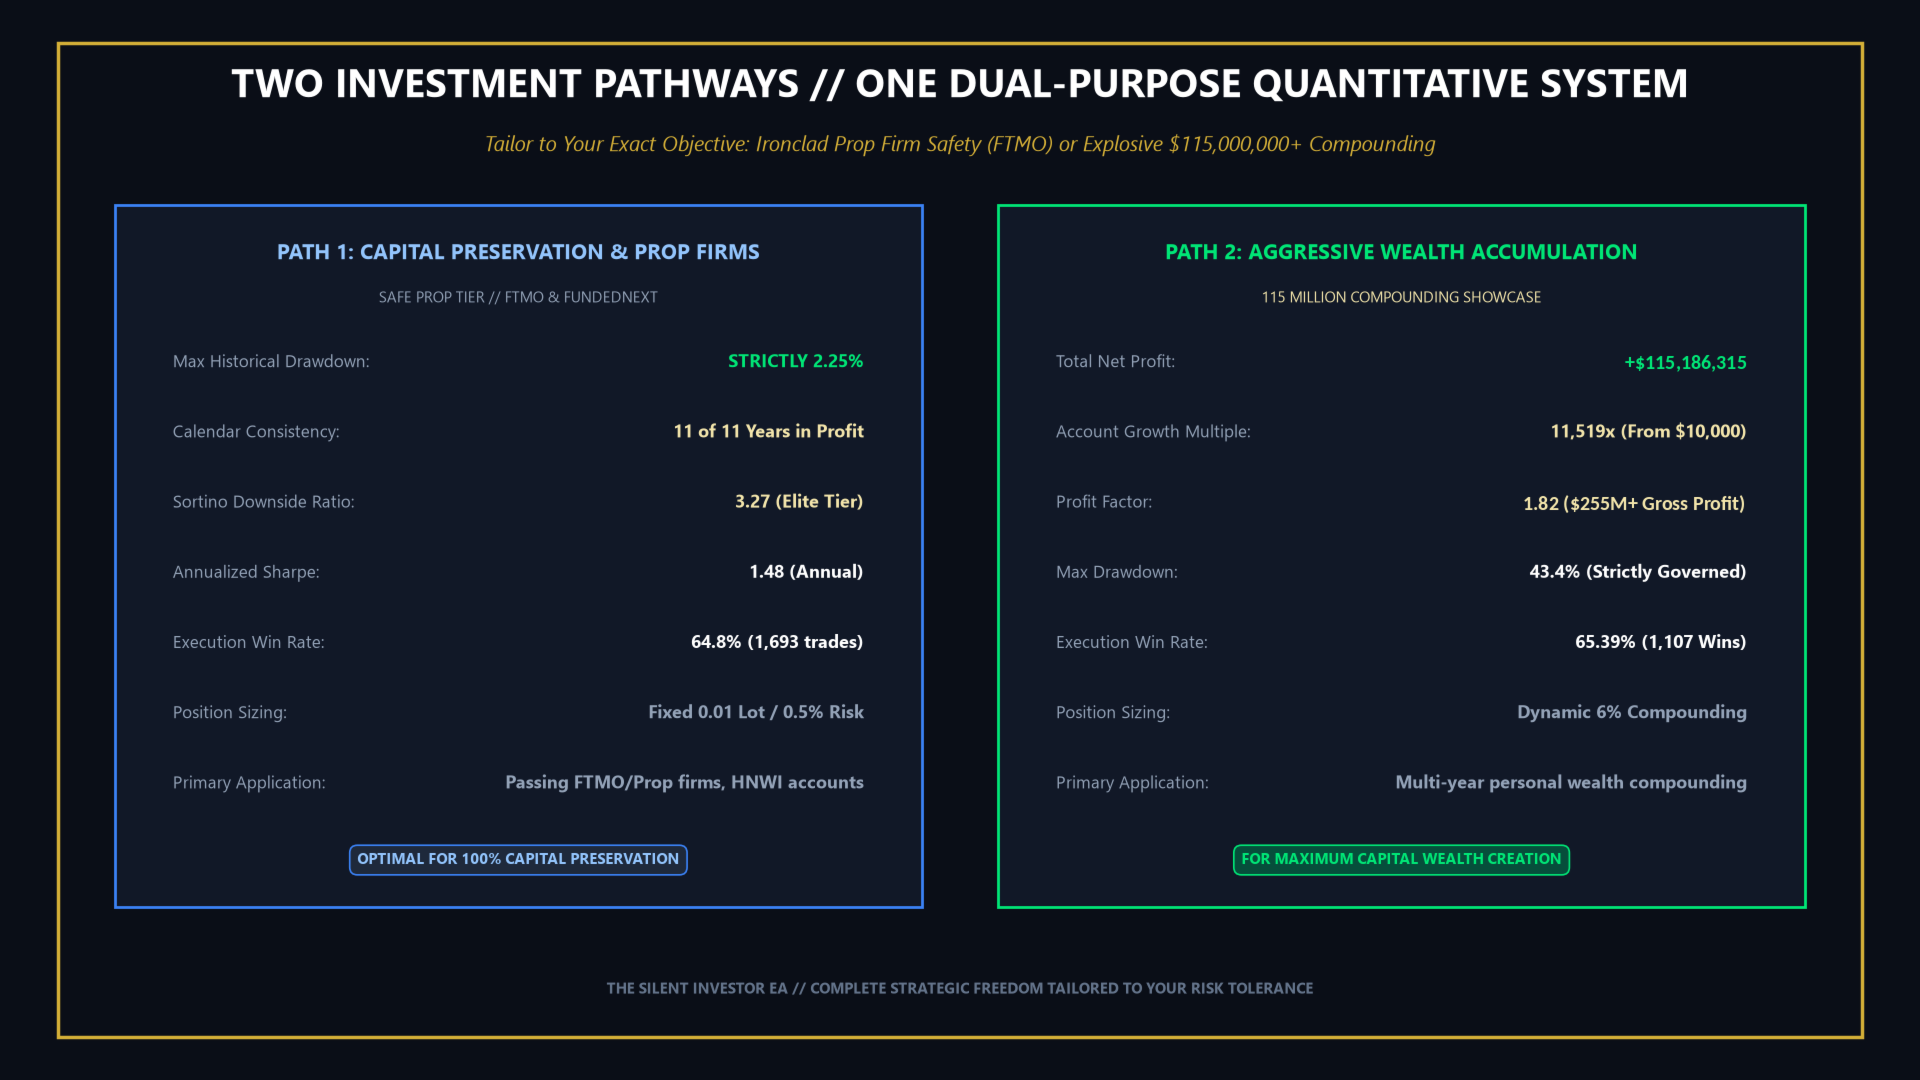
The fixed-lot chart uses a $10,000 baseline and 0.01 lot. It states $5,637.62 net profit and 2.25% drawdown. The main listing instead gives gross profit of $12,872 and gross loss of $9,002, which net to $3,870. Those totals do not reconcile with the chart, so we have not combined them into a single verified result.
The $300.46 drawdown amount is about 3% of the initial $10,000; 2.25% may use an intervening equity peak as its denominator. Either way, that percentage cannot simply be transferred to a $100 account trading the same lot size.
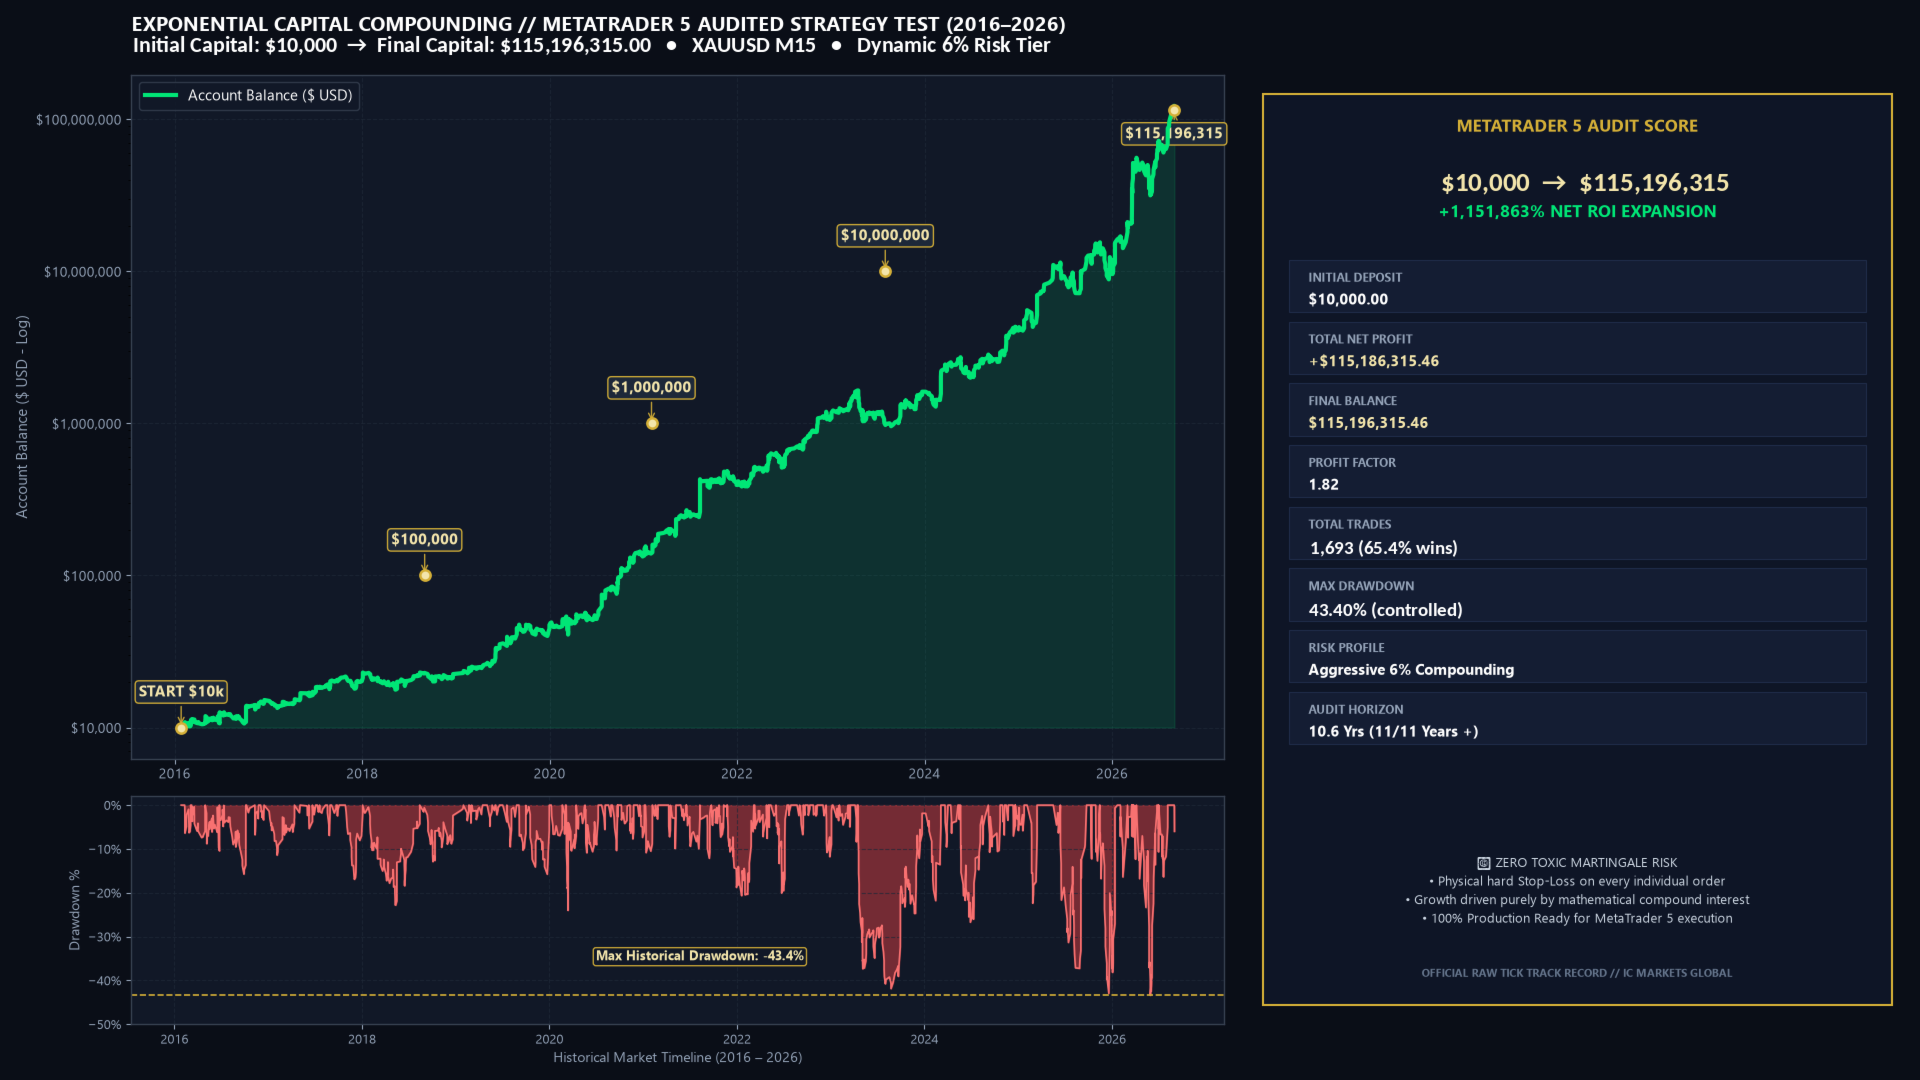
The compounded example is an entirely different risk scenario. Its graphic reports a final balance above $115 million from $10,000, alongside 43.40% maximum drawdown and a 6% aggressive risk profile. The enormous simulated ending balance is not live earnings or a practical return target. Broker volume limits, margin, liquidity and compounding assumptions become material at that scale. Do not pair this chart’s profit with the fixed-lot chart’s 2.25% drawdown.
Annual gains still contain losing months
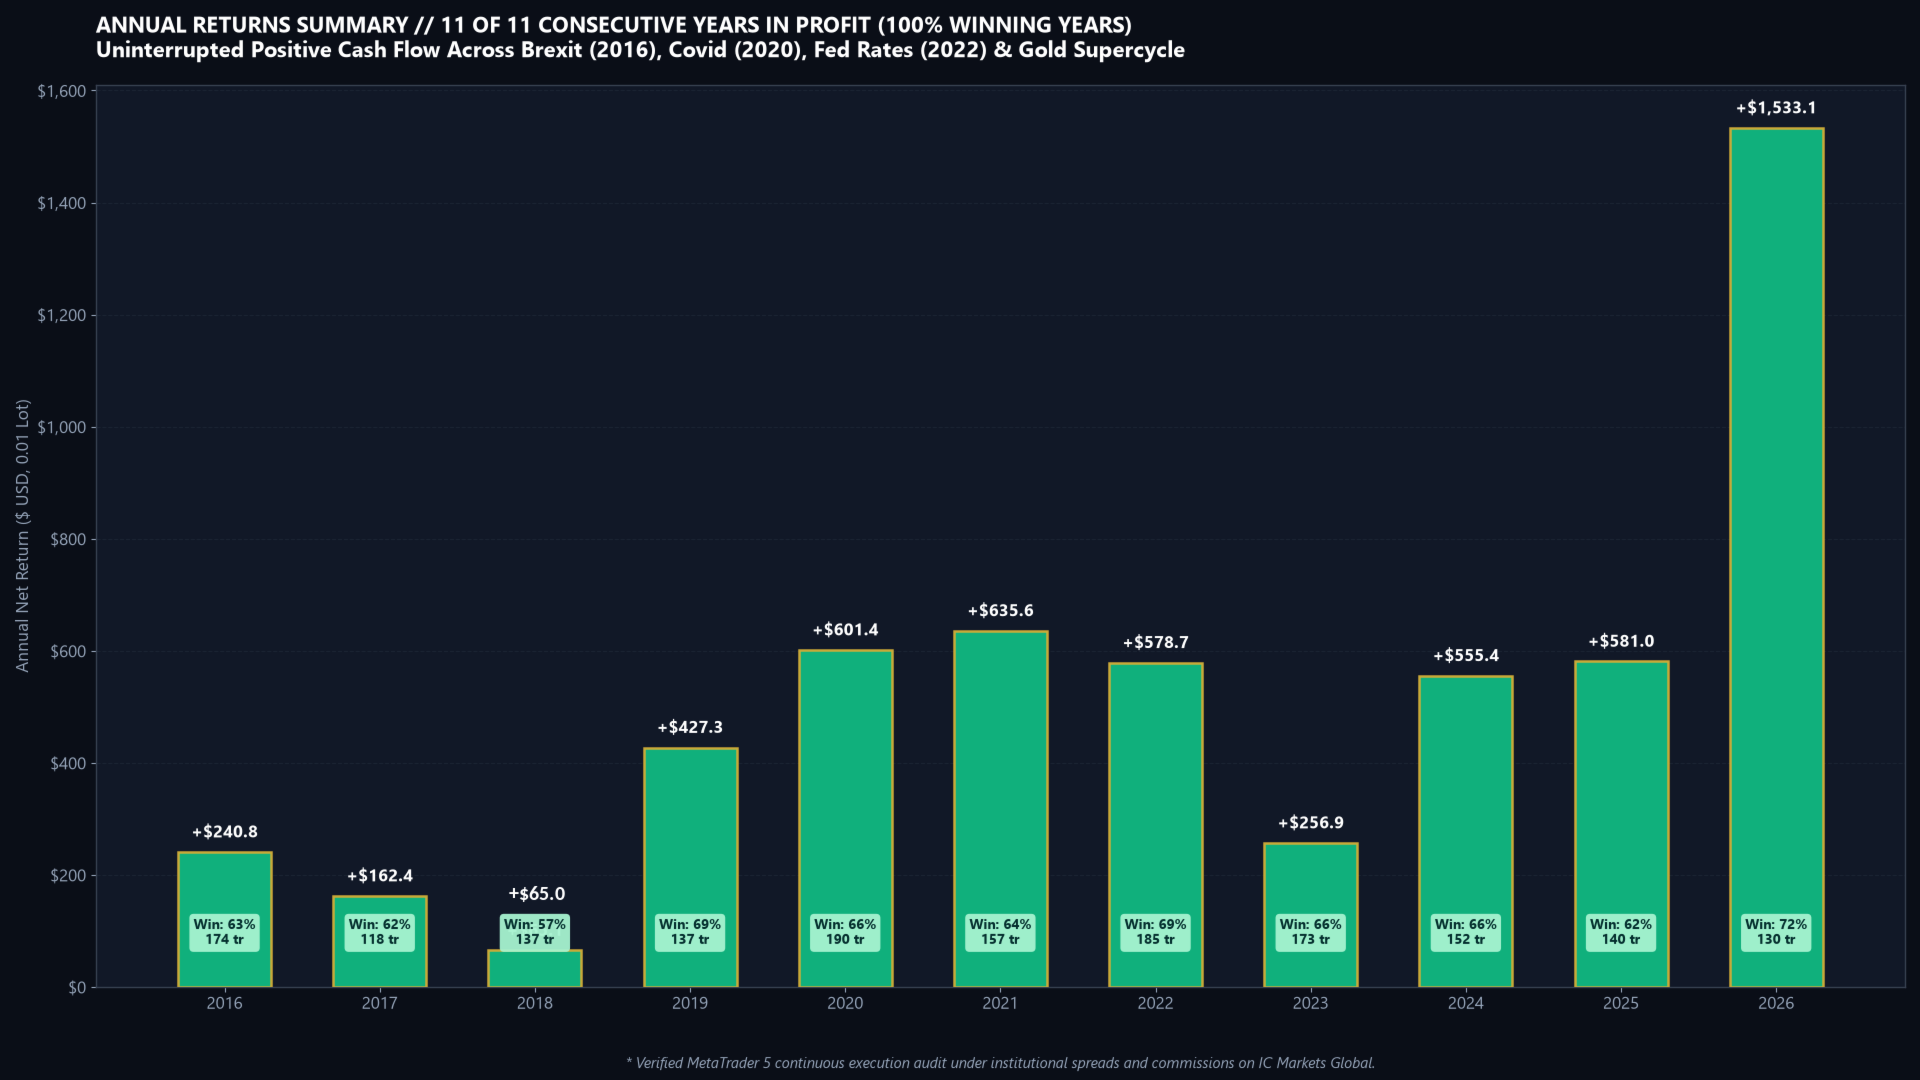
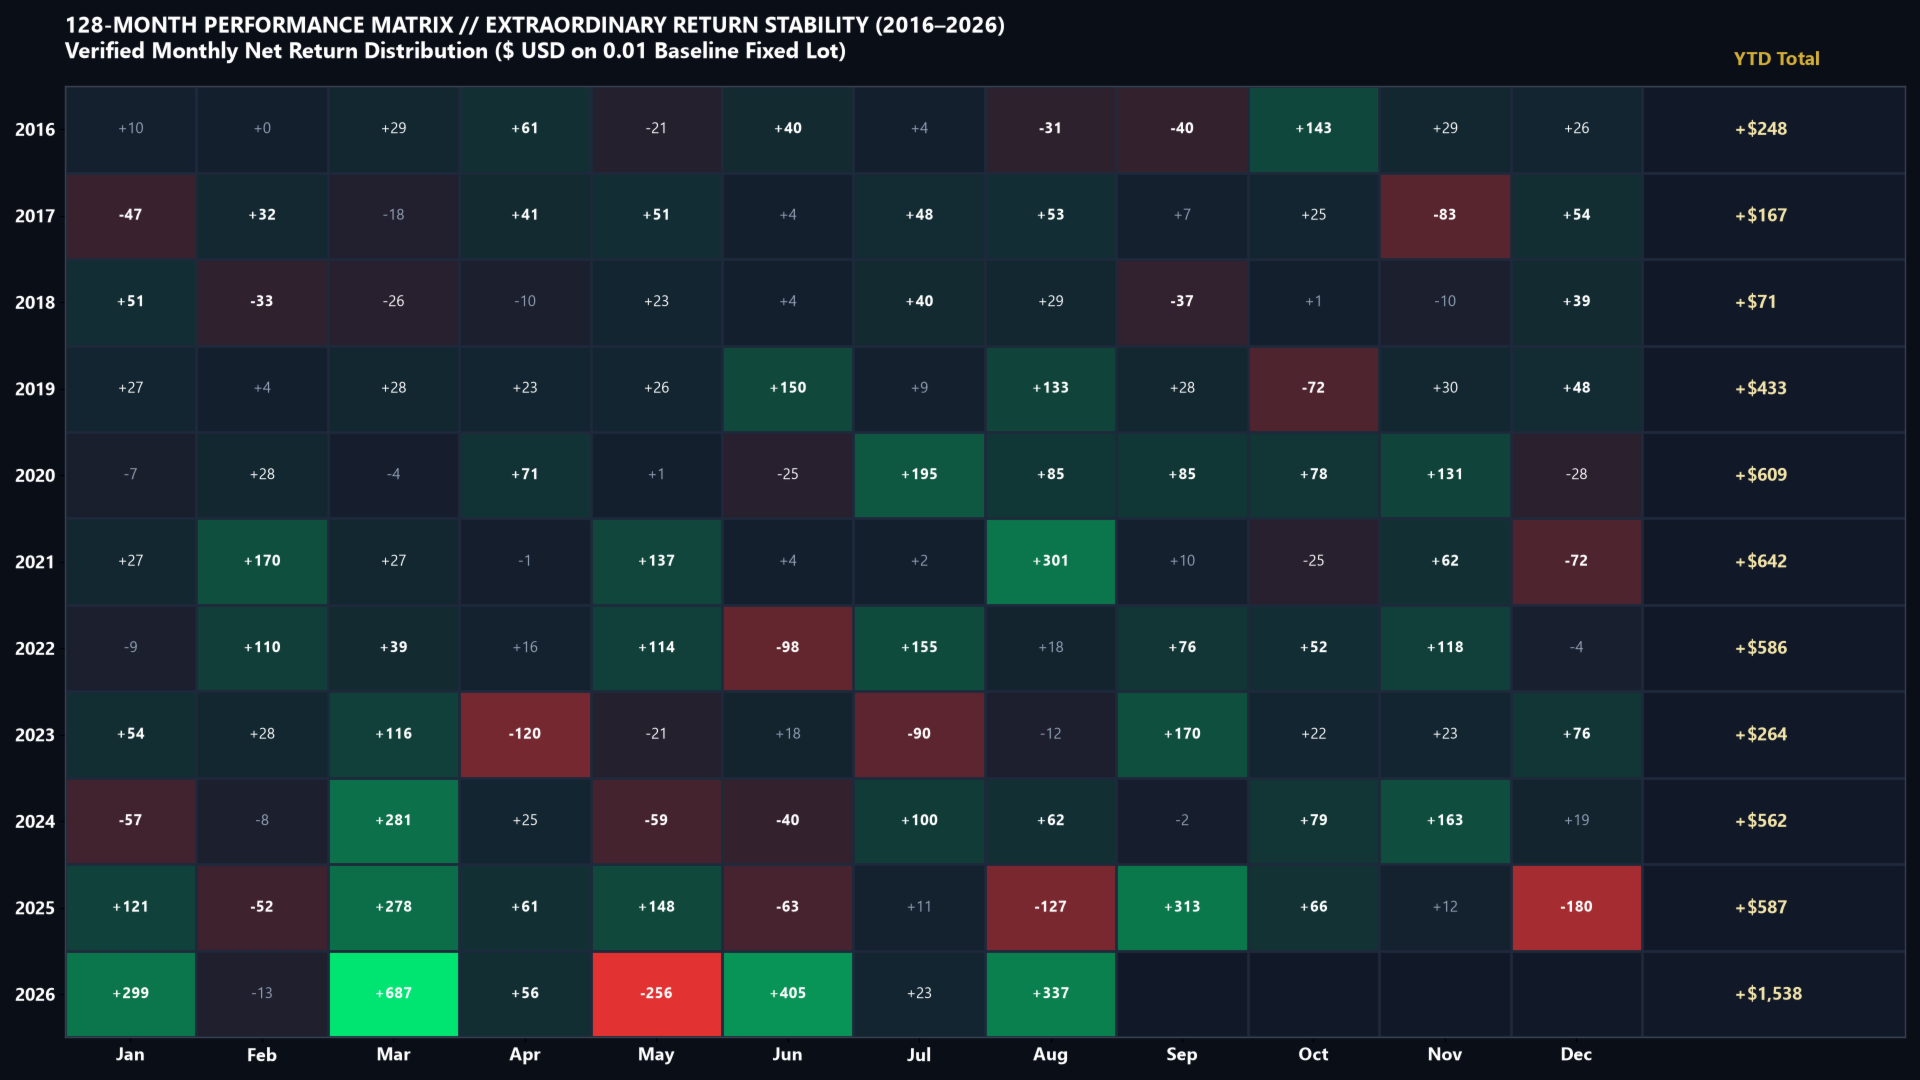
The claim of eleven profitable years counts eleven calendar periods, including partial 2016 and 2026. It is not eleven complete years of live trading. The monthly matrix contains losses, and its unusually strong 2026 period deserves attention rather than assuming a smooth yearly average. Similar charts in the public guide repeat this research; they do not provide a separate independent test.
RiskGuard and presets: check what is actually enabled
The input range extends from fixed lots through 0.5%, 1%, 2%, 3%, 6% and 10% risk profiles. A per-trade setting is not a total-account exposure cap when engines overlap. Daily loss and peak-equity limits are separate controls, as are the options to close existing trades when a limit is reached.
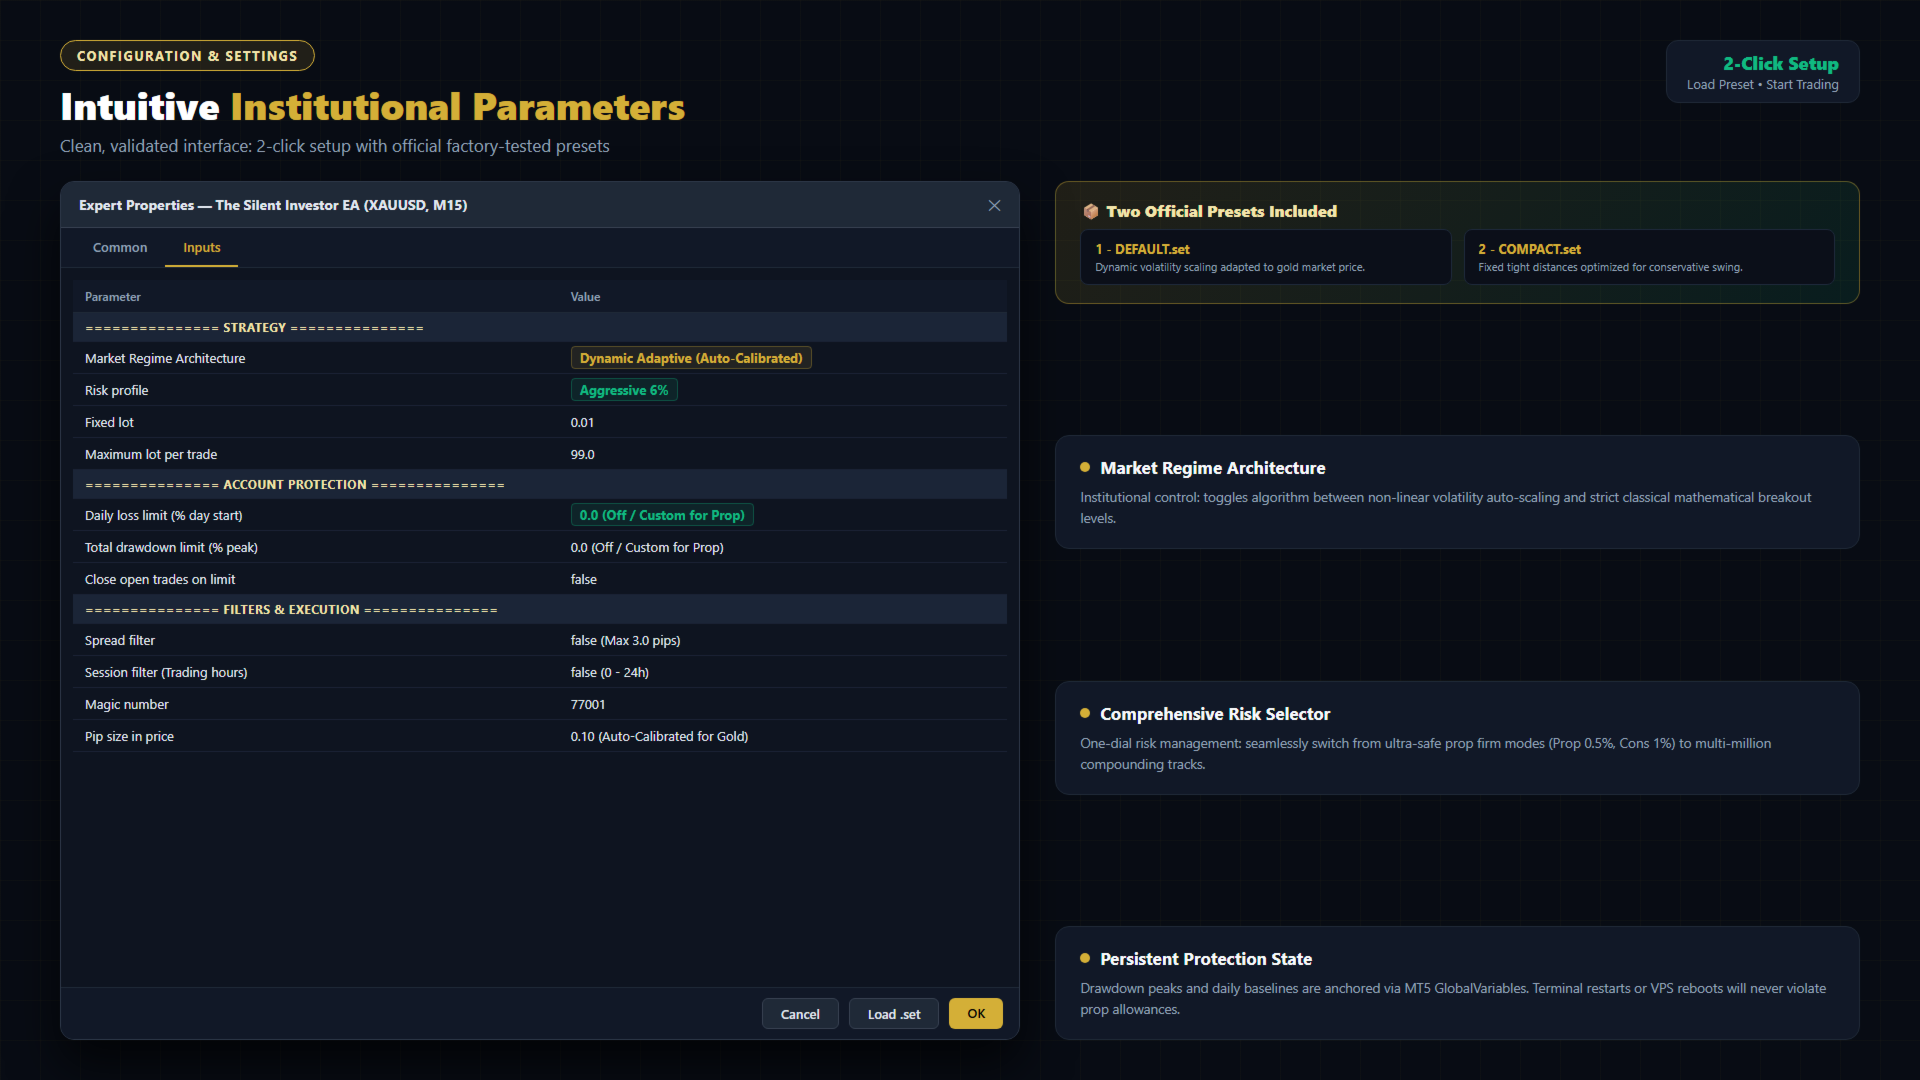
The original illustration shows daily and total thresholds at zero, close-on-limit set to false, and spread/session filters disabled. That makes configuration consequential: the presence of a RiskGuard feature does not mean the supplied preset has every protection active.
The listing says risk baselines persist through terminal restarts using MT5 global variables. This can help preserve accounting state; it cannot guarantee execution at an exact loss threshold. An option to send stops after entry also means protection may be attached after the initial fill, rather than atomically with it.
DEFAULT is described as adaptive scaling, while COMPACT uses fixed distances. The guide gives a price-ratio scaling explanation; the listing describes nonlinear scaling. We would verify behaviour in testing instead of presenting one unqualified formula as established implementation.
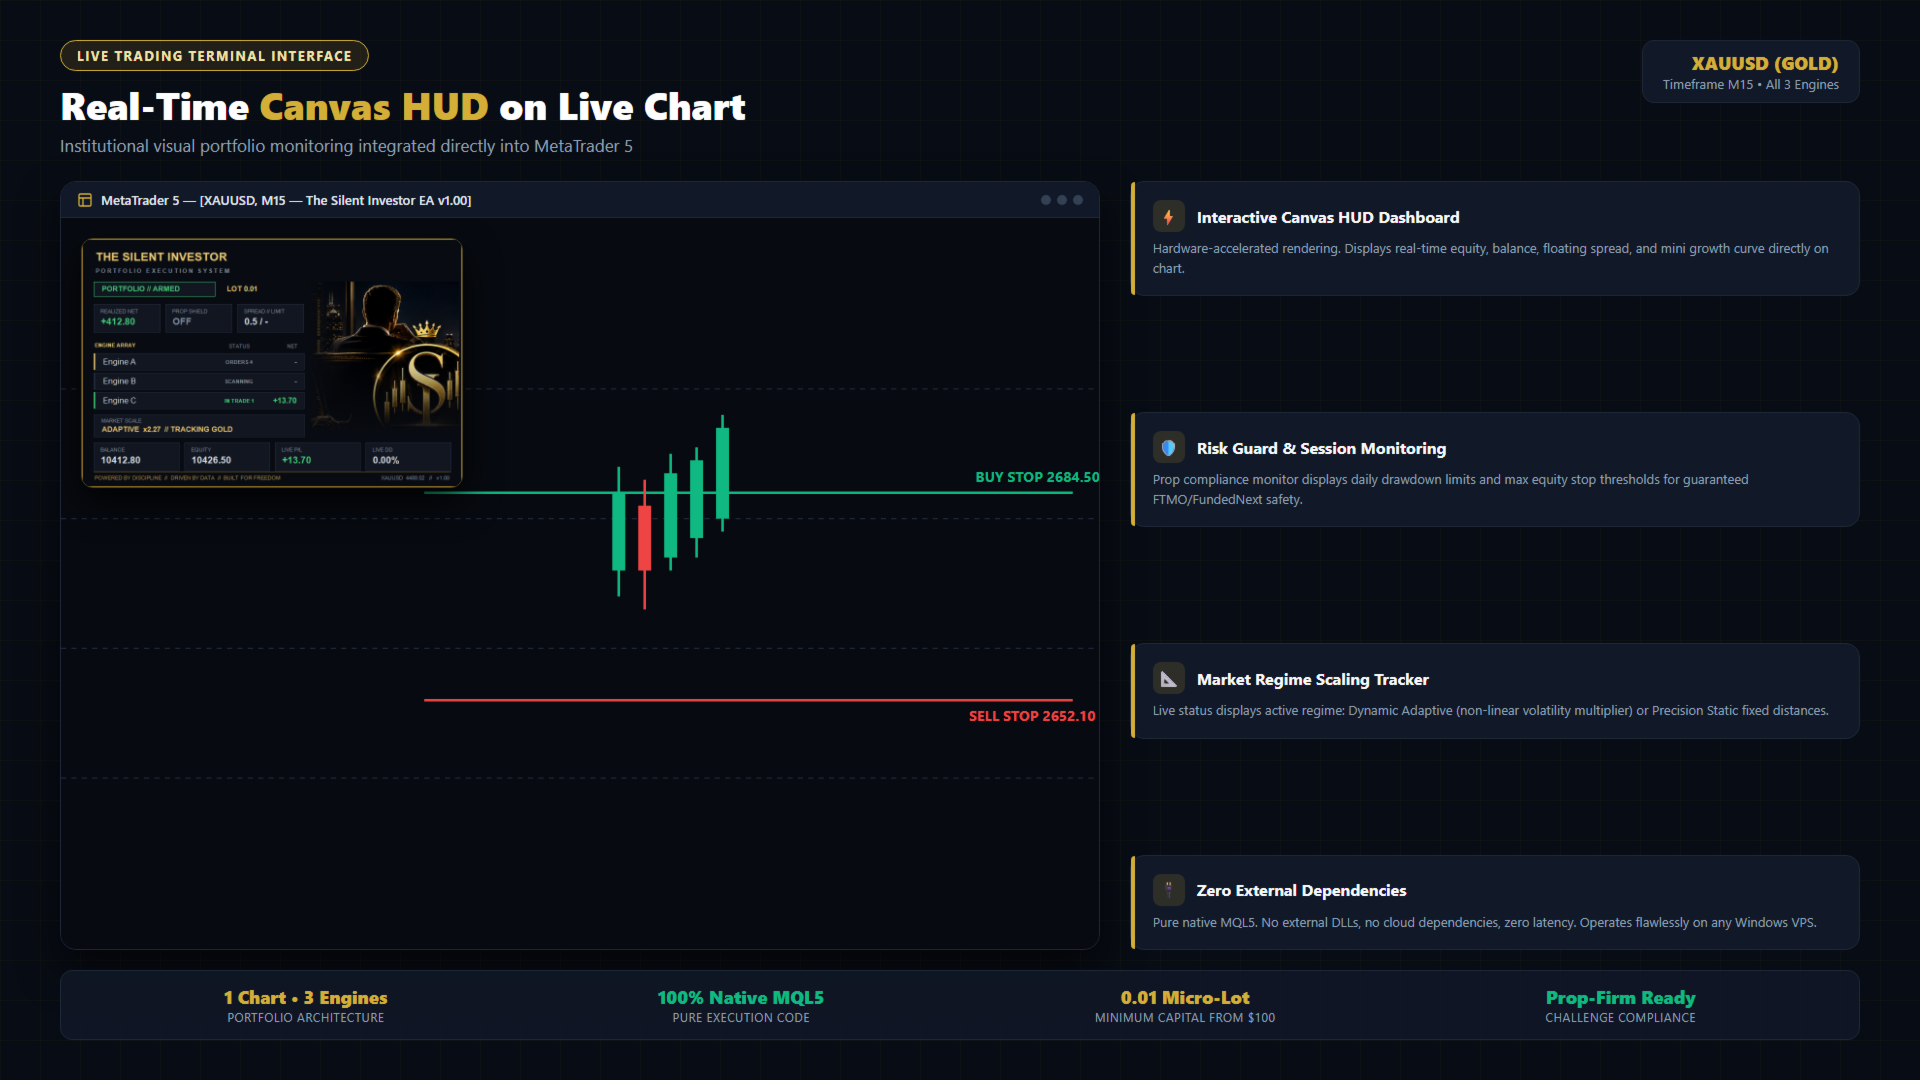
MT5 hedging mode and an XAUUSD M15 chart are required. Netting is unsupported. No DLL or external WebRequest dependency is listed. Check symbol contract size, stop distances, broker server time, spread and margin on demo. The $100 advertised minimum does not recreate the $10,000 fixed-lot backtest’s risk.
“Prop-firm ready” language in source images describes the developer’s positioning, not a guarantee from us. Account rules differ, and configured loss limits do not by themselves establish compliance.
Customer reviews and documentation
There were no published customer reviews or comments visible on the listing when checked on 14 September 2026. There is therefore no genuine buyer-review excerpt to show yet. Ratings on the author’s other EAs are not ratings for Silent Investor.
The linked public user guide provides strategy explanations and historical charts. The listing separately advertises a private PDF and settings sent to its MQL5 buyers; those private materials were not available for this research and should not be assumed to be included in another seller’s offer.
More from Valentina Zhuchkova
We also sell these separate EAs from the same developer. Compare their own strategies and evidence rather than assuming results transfer between products.
- Atherion Zenith MT5 · Atherion Zenith MT5 review
- Nexorion Initium Novum MT5 · Nexorion Initium Novum review
- ZenQ Flow MT5 · ZenQ Flow review
Verdict
The strongest reasons to examine Silent Investor are its distinct gold entry engines and configurable exposure controls. The best reasons to stay measured are the short monitored history, mismatched historical totals and the sharp difference between fixed-lot and compounded risk. Evaluate the actual settings and allow more forward observation before relying on the headline charts.
View The Silent Investor EA MT5 product and current price
Offer: standalone file, with free lifetime updates.
Also from Valentina Zhuchkova: Umbra Vault AI EA MT5 focuses on gold momentum and automated exit management. Read our Umbra Vault review for its original reports and the linked signal’s platform distinction.