
SomaBTC combines 18 BTCUSD breakout strategies with portfolio sizing and explicit session controls. It offers a more structured approach than a single Bitcoin entry rule, but the live evidence is currently less convincing than the historical tests: the public account was slightly negative overall at our check after a substantial drawdown.
View product details and current pricing.

Our assessment
The attraction is the breadth of the research and the ability to monitor an entire Bitcoin portfolio from one MT5 chart. The main reservation is the gap between the backtests and the public account. It is suitable for investigation by traders prepared to test broker execution and tolerate losing periods; the available live history does not support calling it a proven long-term winner. We have reviewed public sources rather than forward-tested it ourselves.
Public signal: recovery does not yet mean an overall profit
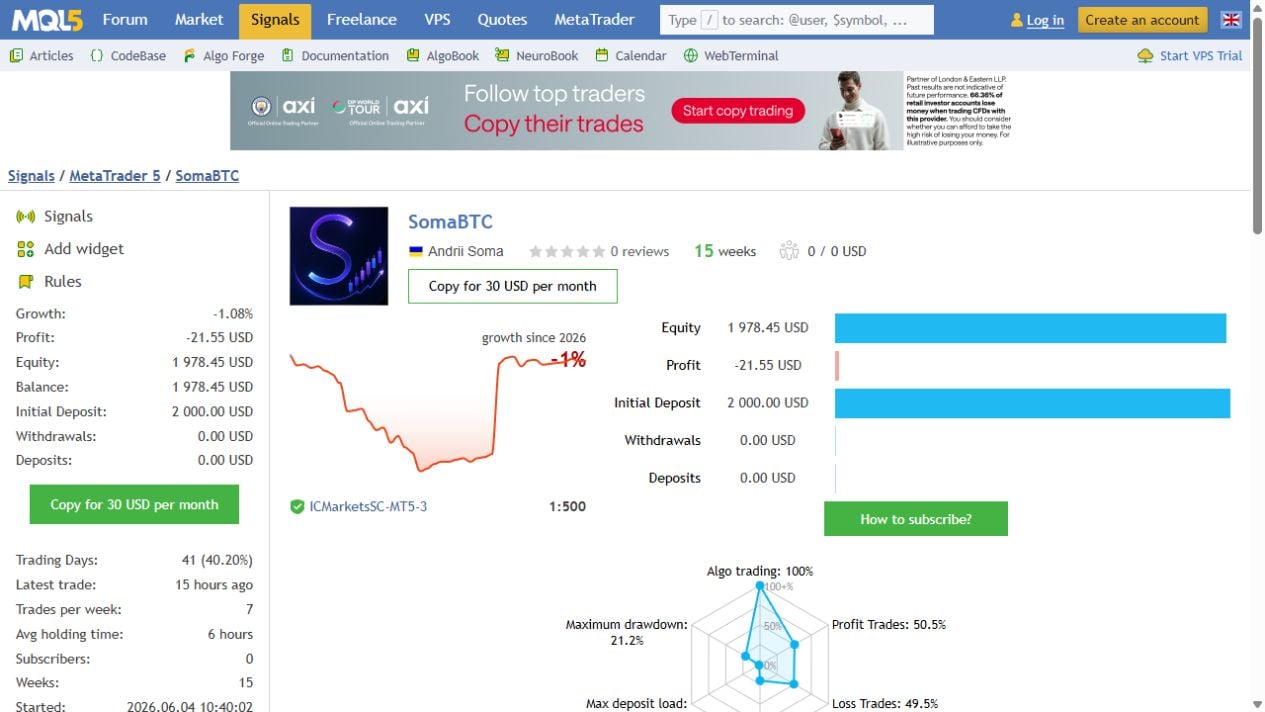
On 14 September 2026, MQL5 identified the account as real on ICMarketsSC-MT5-3, with 1:500 leverage. It began on 4 June and showed 15 weeks of history. The initial deposit was $2,000, with no further deposits or withdrawals displayed.
| Growth and profit | -1.08% growth and -$21.55 profit. |
|---|---|
| Balance and equity | $1,978.45 at the snapshot. |
| Drawdown | 21.23% maximum balance drawdown; 17.56% relative equity drawdown, as separately reported by MQL5. |
| Trading activity | Latest trade 15 hours before the check; about seven trades per week and six hours average holding time. |
Inspect the current SomaBTC signal
The curve shows a recovery from its earlier trough, but the account was still below its starting capital. The balance drawdown also exceeds the 10–15% historical balance-drawdown targets discussed in the development process. Those were optimisation constraints for particular tests, not live stop-loss guarantees.
What the 18 strategies actually diversify
The EA mixes different swing ranges and internal D1, H12, H8, H4 and H1 timeframes. Each strategy has separate identifiers, exits and allocation settings, while all use the same execution engine. This can spread entry timing; it does not diversify away from Bitcoin itself. Several systems can still lose during the same false breakout or sudden change in liquidity.
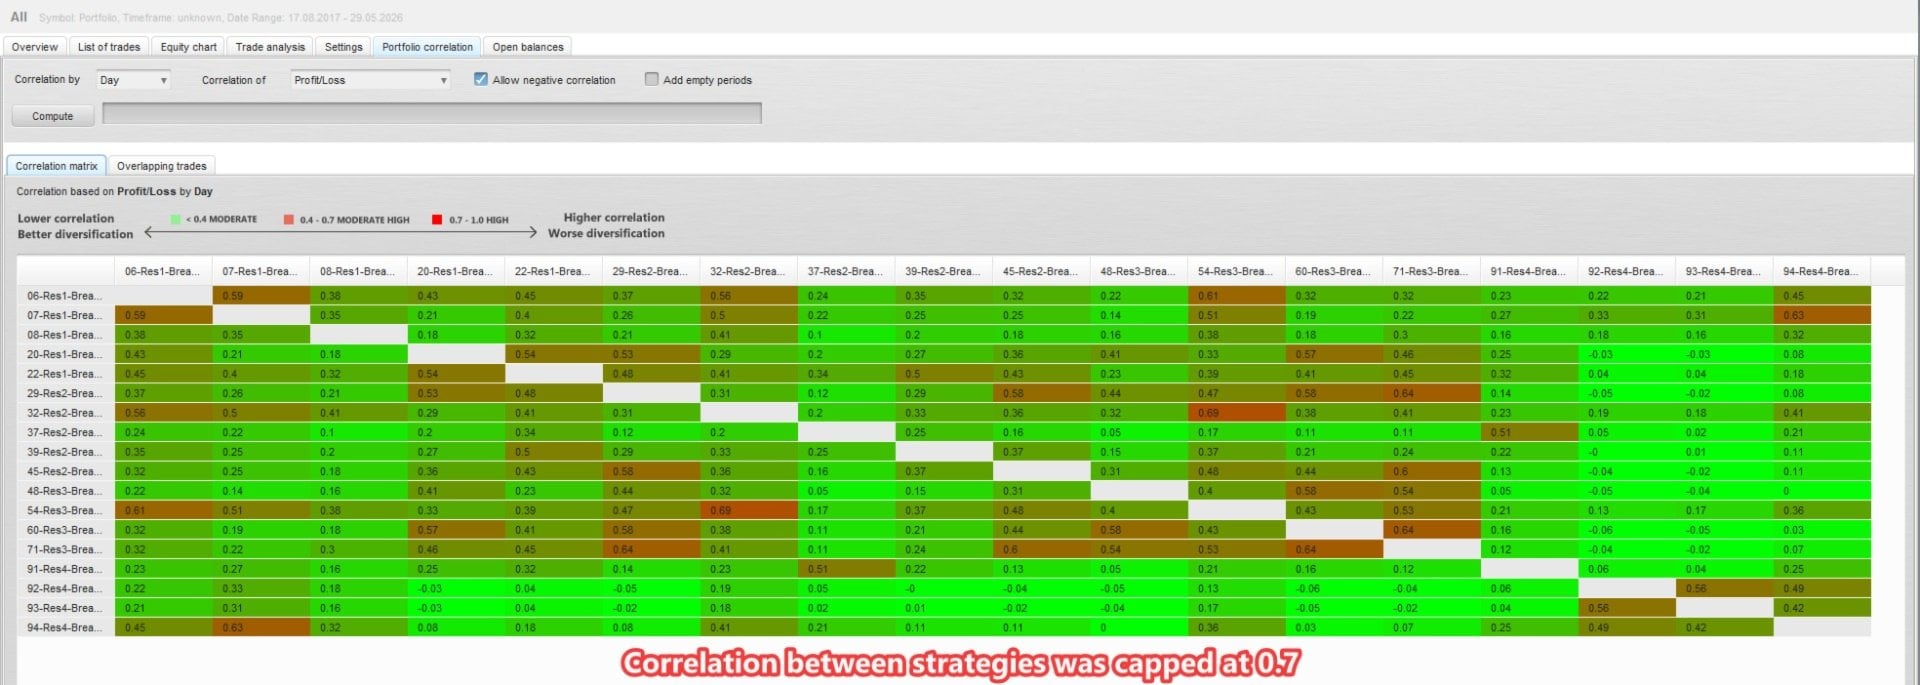
Four research groups, with different evidence strength
Five selected strategies came from the first research range, five from the second, and four each from the third and fourth. The first two use complementary halves of the same 2017–2026 history for training and validation. The third explicitly has no out-of-sample period. The fourth is described through a recent-period one-minute versus real-tick comparison; its gallery additionally labels earlier history out of sample. The tick comparison itself is a data-model check, not an unseen future test.
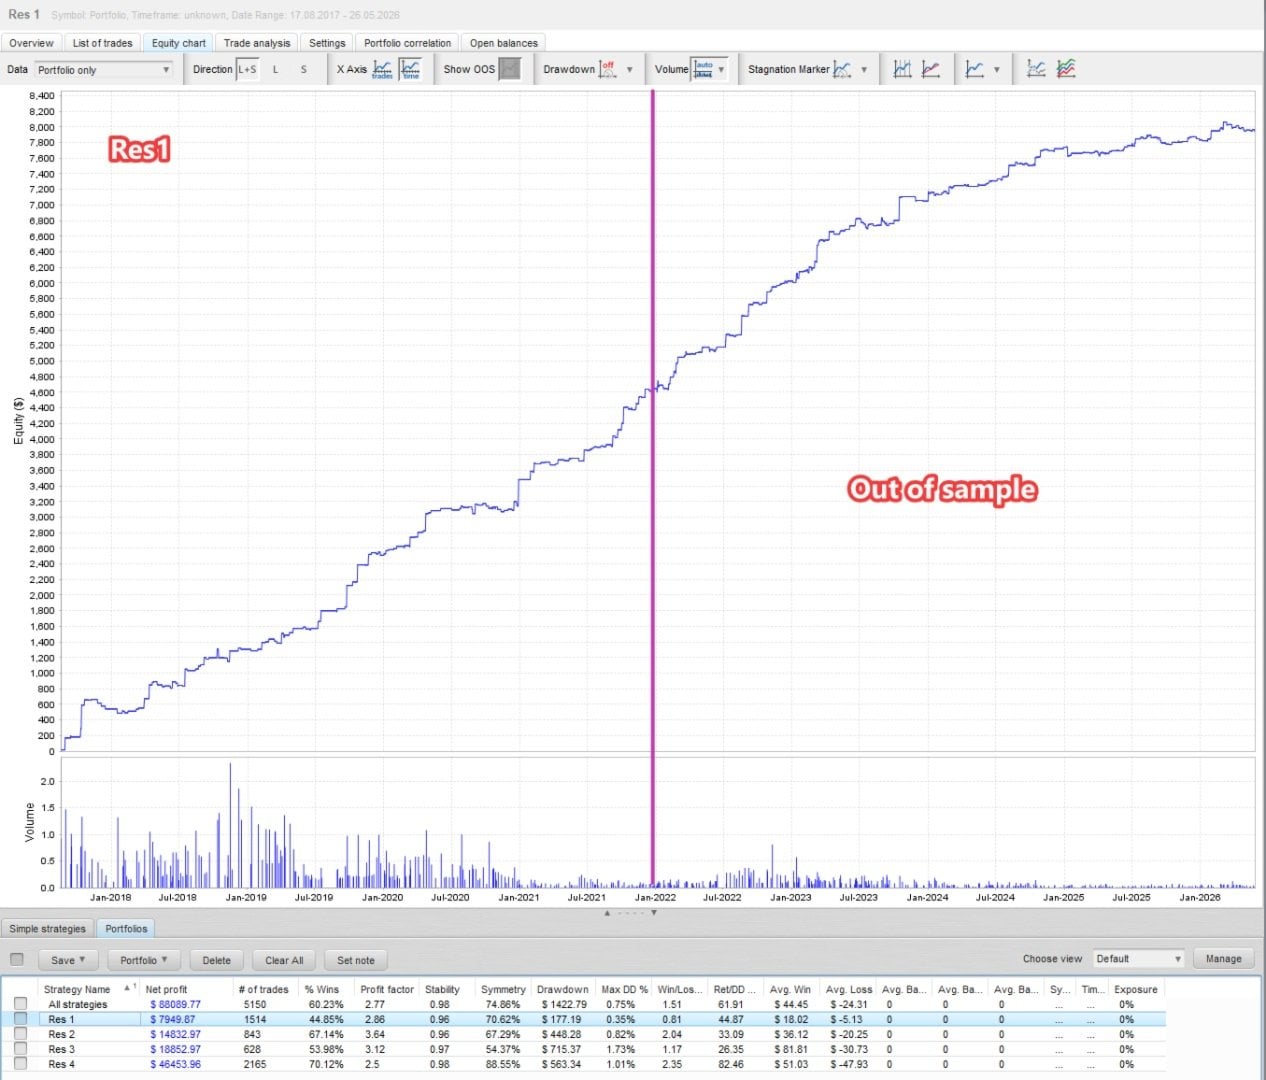
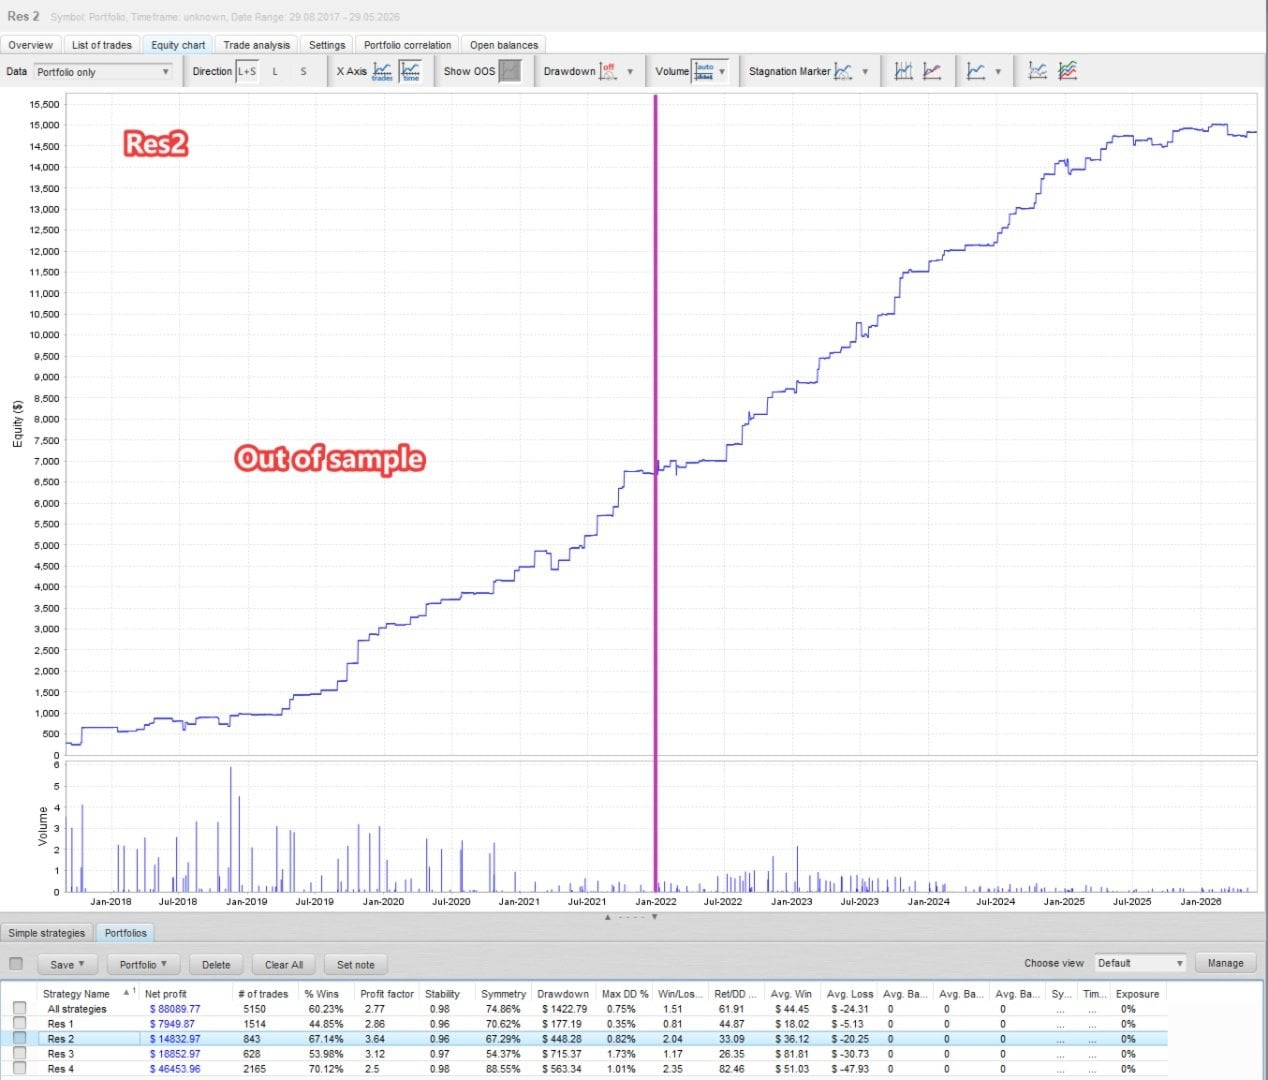
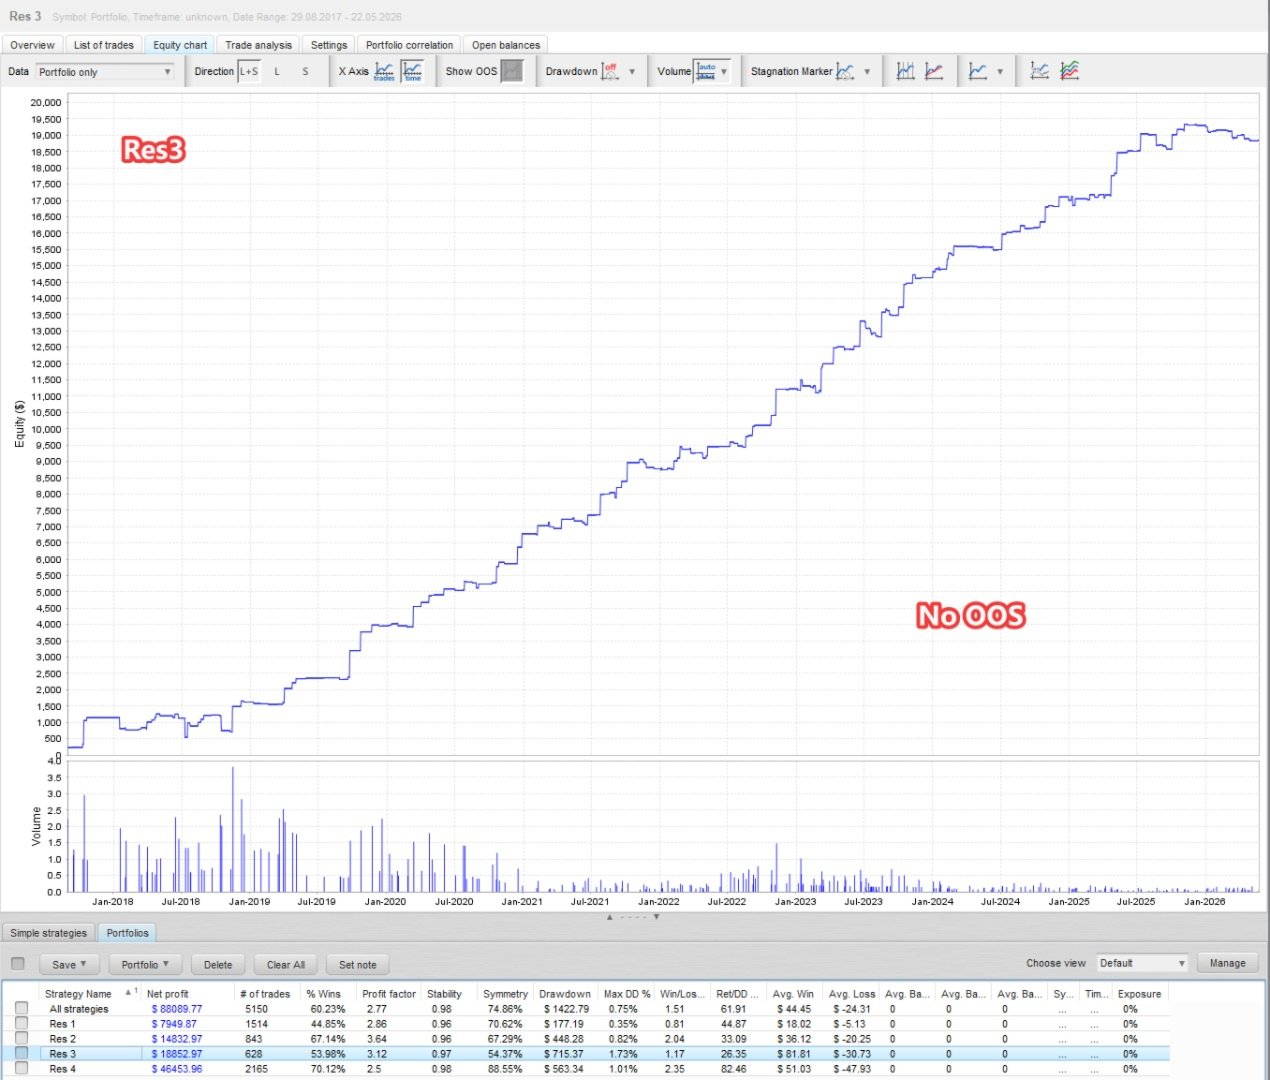
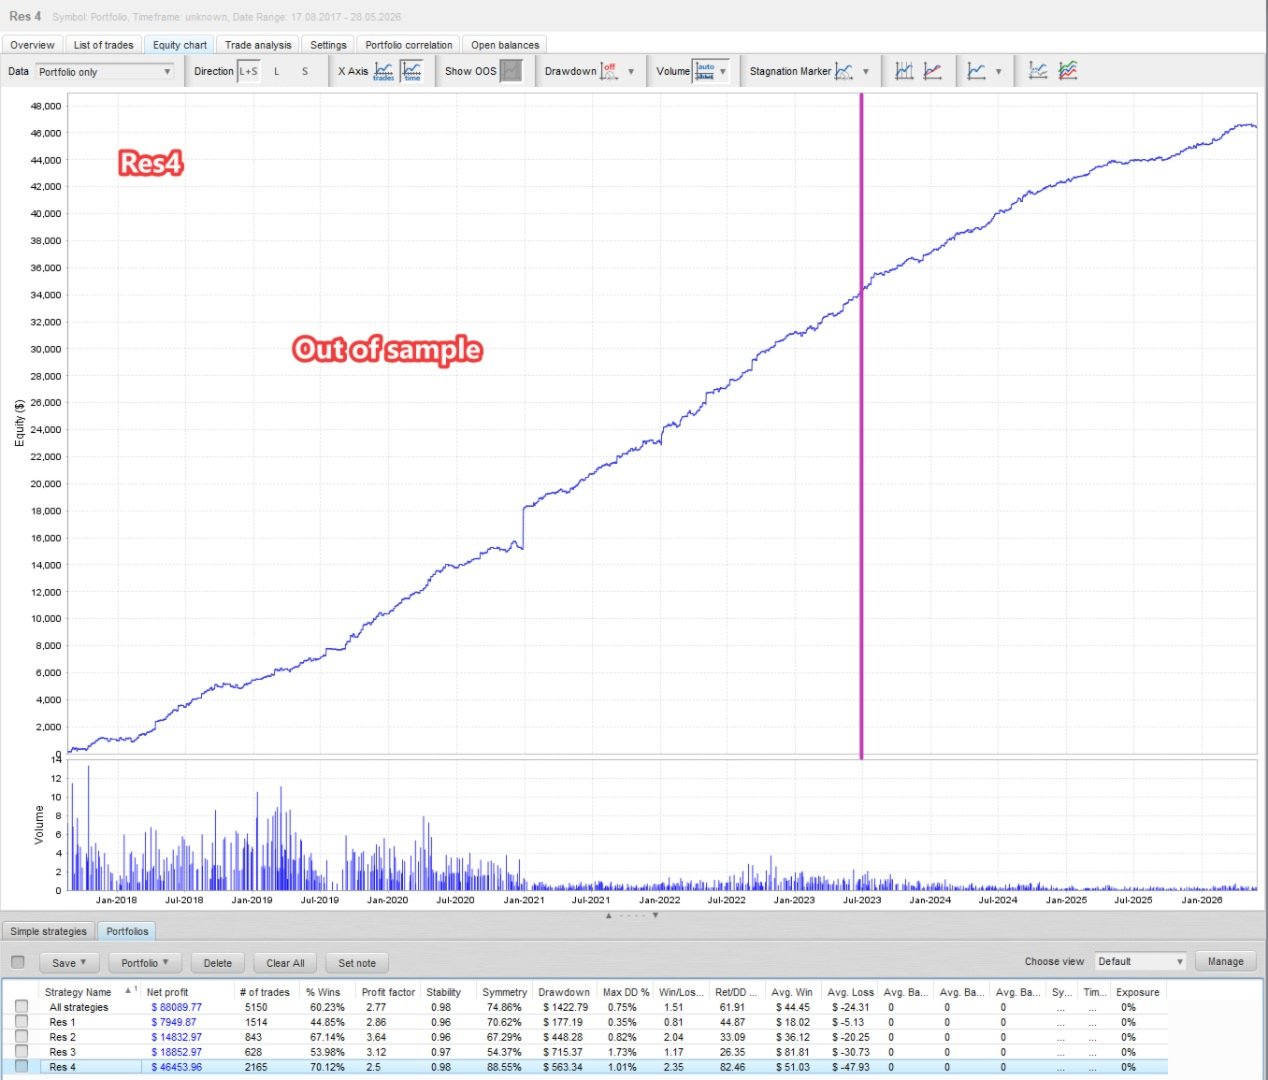
Selecting candidates partly on out-of-sample performance also means that the chosen portfolio has been influenced by those results. The developer provides useful research transparency, but the final aggregate should not be treated as wholly untouched validation.
Real ticks versus one-minute modelling
This is one of the most informative image pairs. On a $10,000 starting deposit, the real-tick report shows $16,029.28 net profit and a 1.75 profit factor; the one-minute report shows $23,230.48 and a 2.29 profit factor. The curves have a reported 0.96 correlation, yet the cash outcomes differ substantially. Similar shape does not mean equivalent execution.
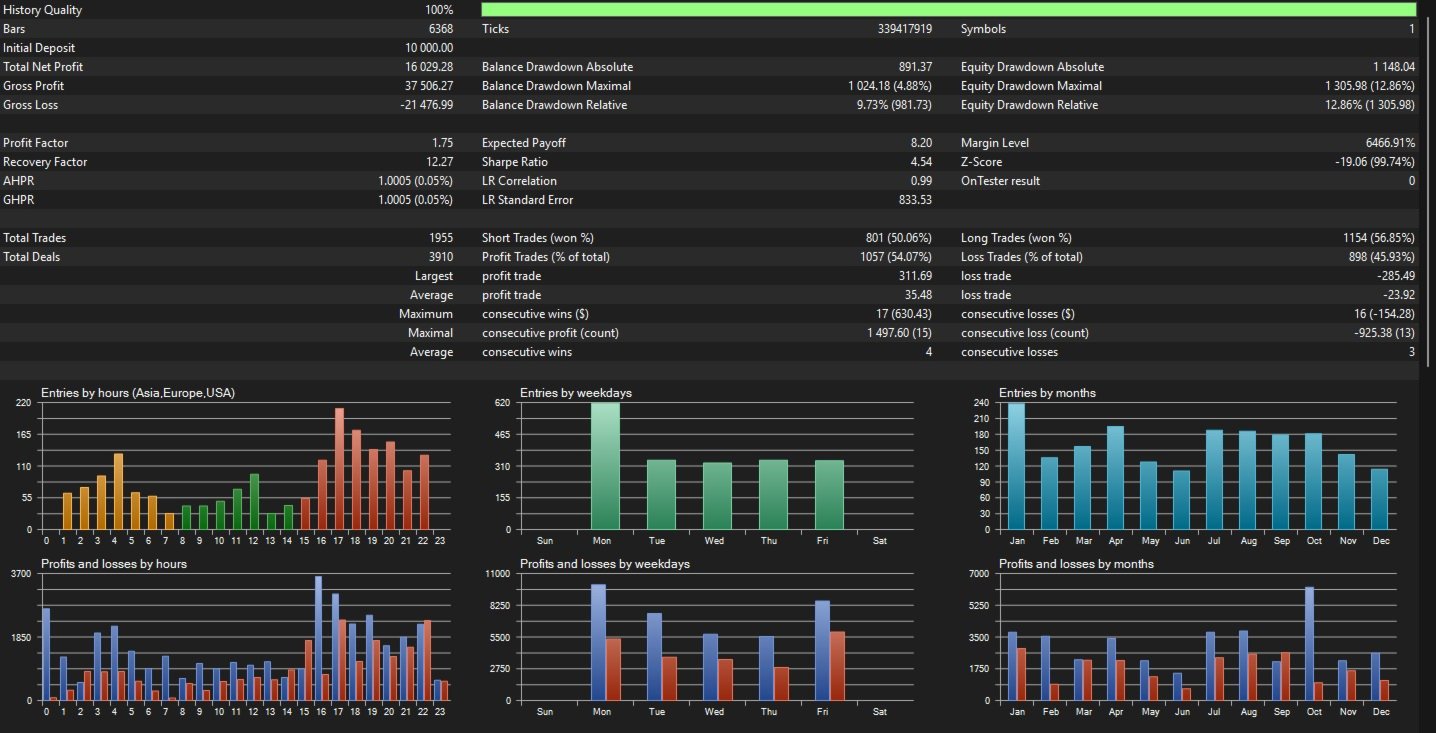
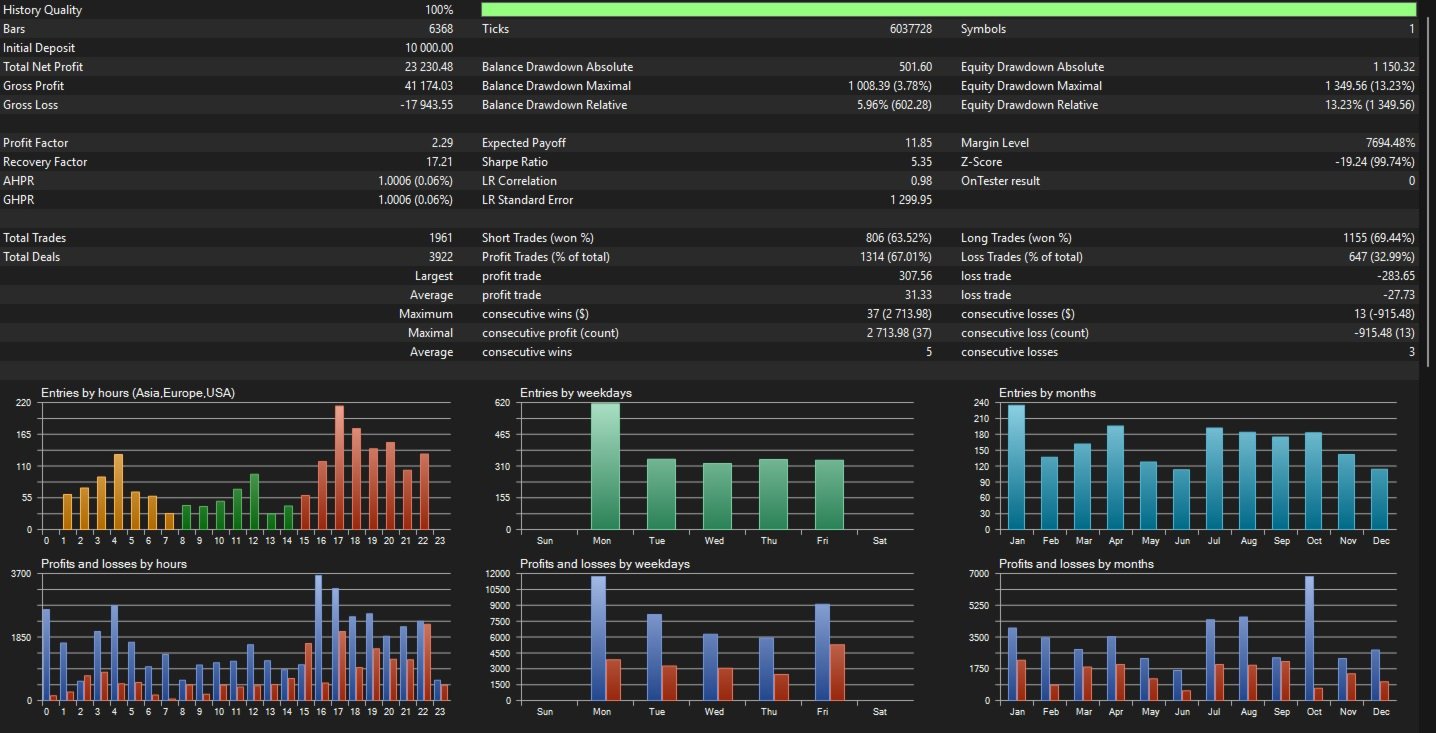
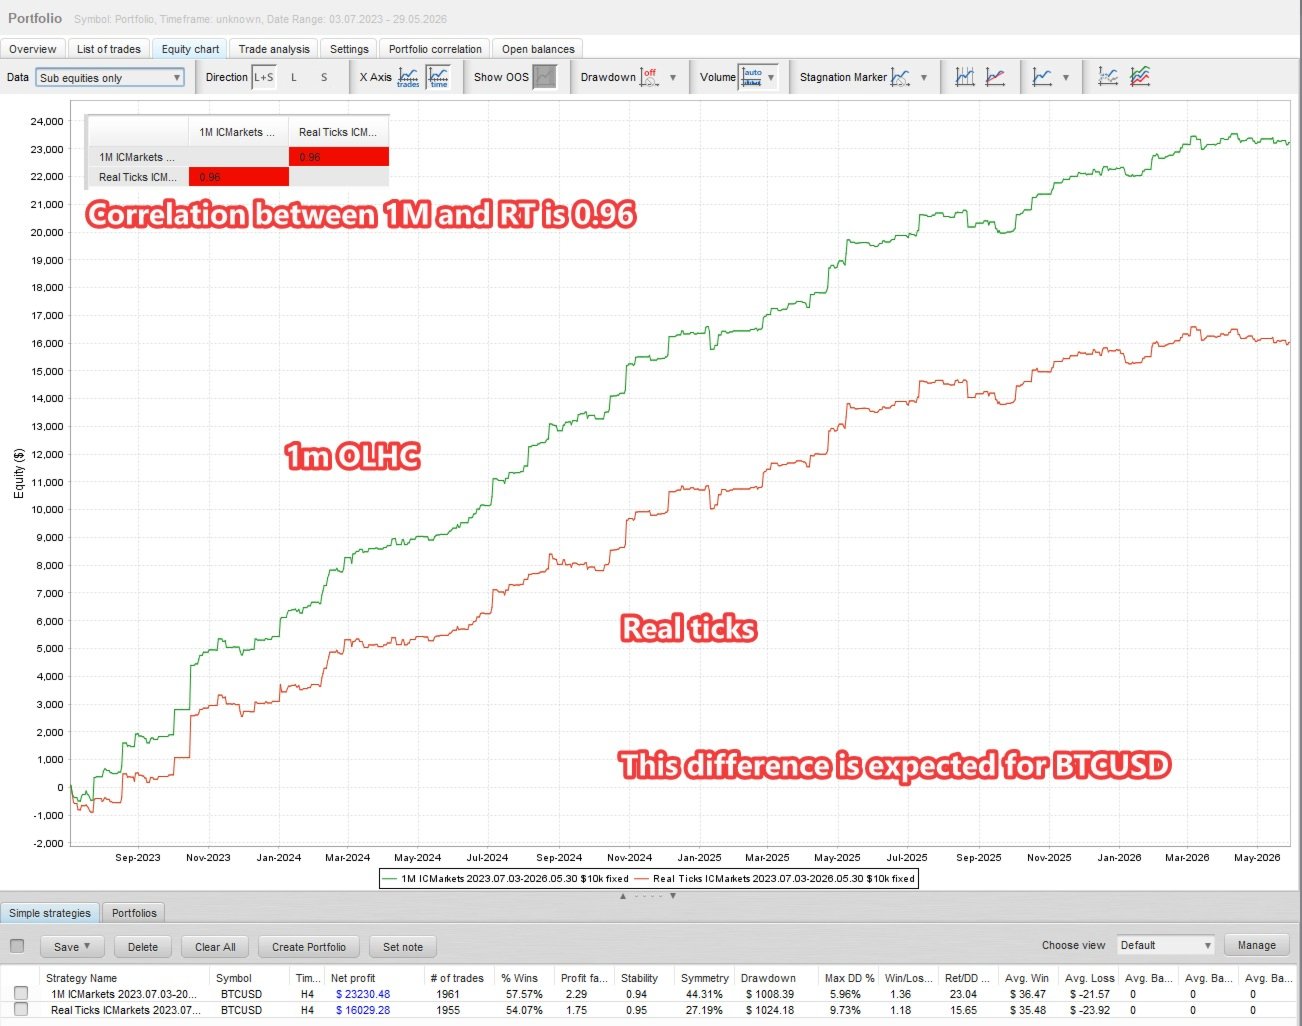
The real-tick report’s relative equity drawdown is 12.86%, compared with 13.23% in the one-minute report. These historical tests do not override the larger drawdown in the public live account, and cannot reproduce every broker’s spread, slippage and financing costs.
The larger historical returns
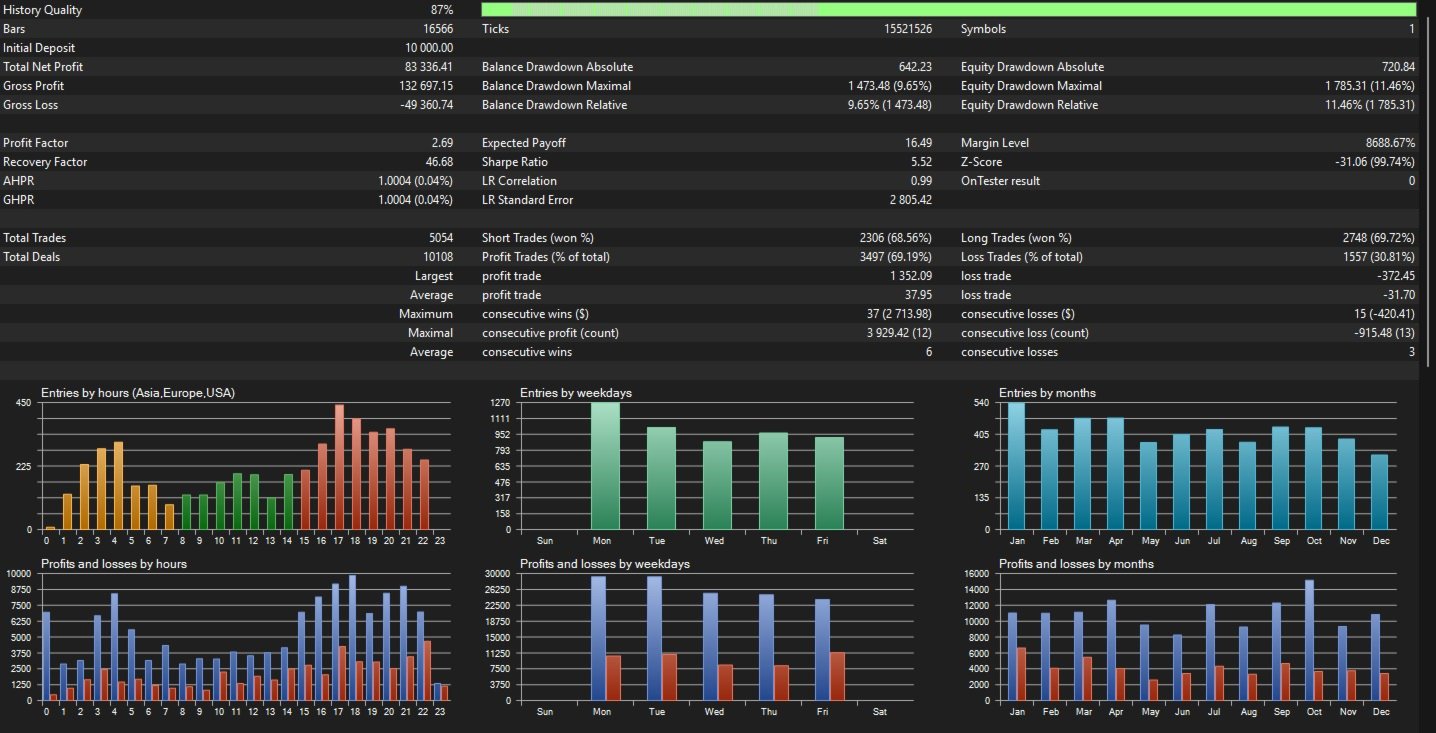
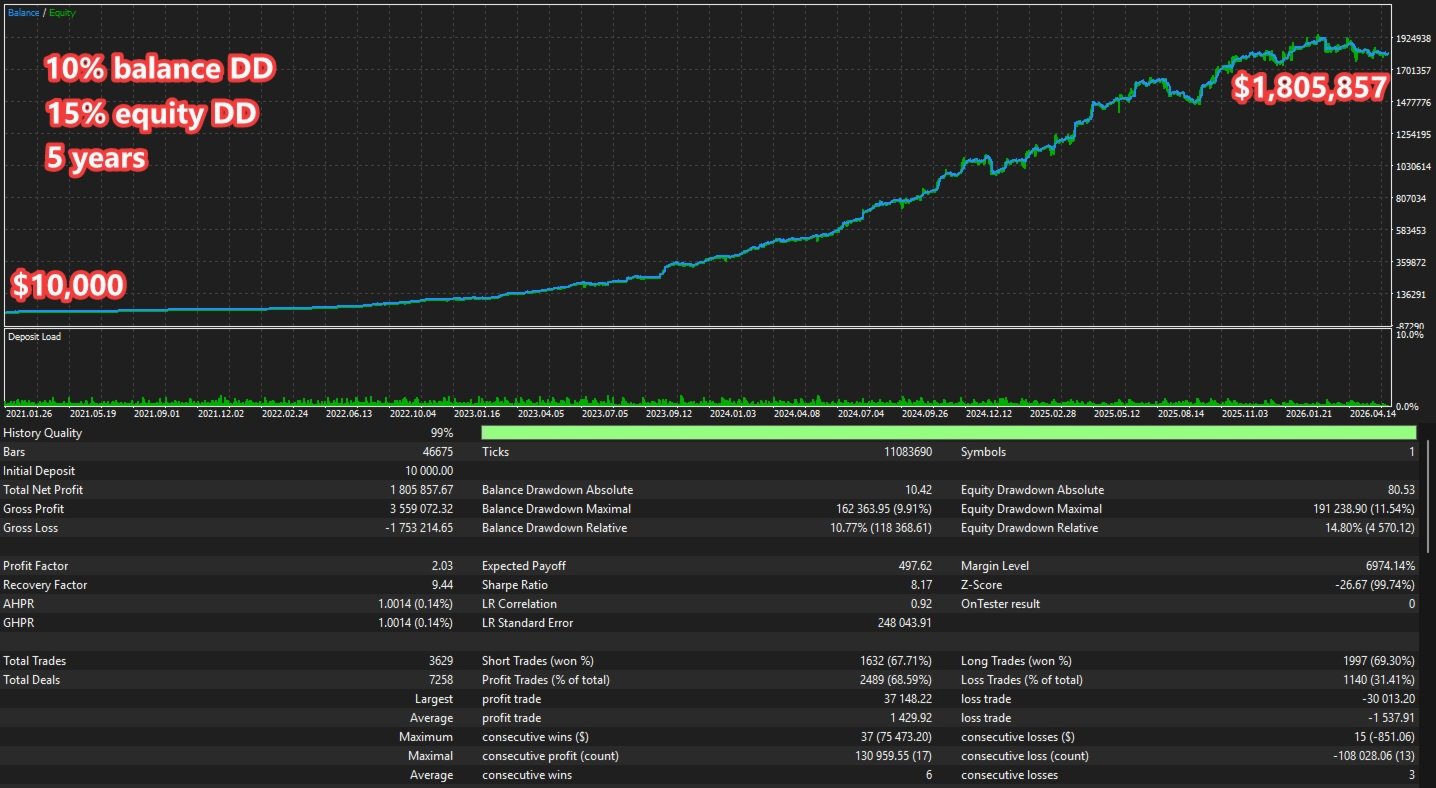
A broader report shows 5,054 trades, a 2.69 profit factor and 87% history quality. A separate compounded run from approximately 2021 to 2026 shows a 2.03 profit factor and 14.80% relative equity drawdown. The large profit annotation belongs to that simulated compounding run; it is not money earned in the linked public account.
Session filters and sizing deserve attention
SomaBTC defaults to closing at the end of the US session and restarting after the Asian session opens. The weekly filter also avoids weekend exposure by default. A broker offering weekend BTC trading does not mean the portfolio was optimised for that schedule. Turning these filters off is a strategy change worth retesting.
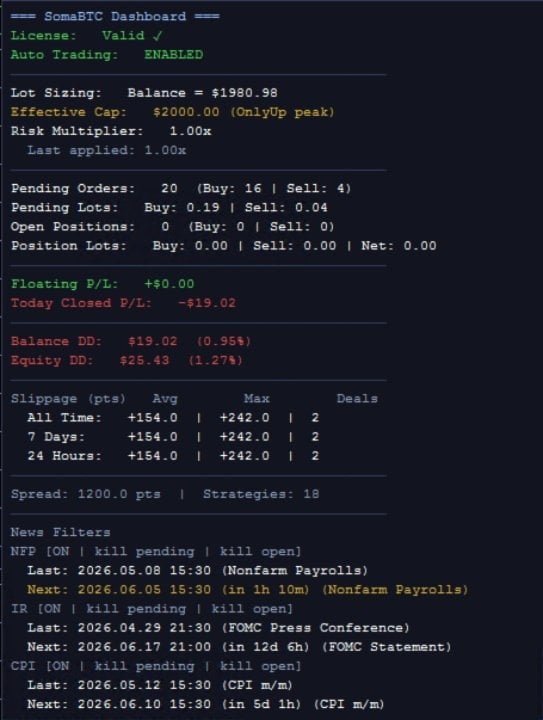
The sizing options include fixed lots, capital steps, balance or equity, a global multiplier and a maximum lot cap. OnlyUp retains a peak-capital reference through drawdowns, so it can maintain exposure when an ordinary equity-based calculation would shrink it. Pending-order margin protection helps avoid over-allocation, but is not a guarantee against losses or a margin call.
News handling covers NFP, CPI and rate decisions, with strategy-specific windows. Optional daily-loss, no-hedge and pending-order limits are separate controls, disabled by default; their presence is not blanket prop-firm approval.
Customer feedback: very little evidence yet
One MQL5 product review was visible on 14 September 2026. The August comment from russham111 praises the developer and the EA, but contains no account statement, risk settings or measured period. It provides a small piece of buyer sentiment rather than a basis for validating performance.

Read the original MQL5 review. Third-party feedback is kept separate from CheaperForex verified-purchase ratings. No public product comments were available at this check.
How it relates to SomaGold
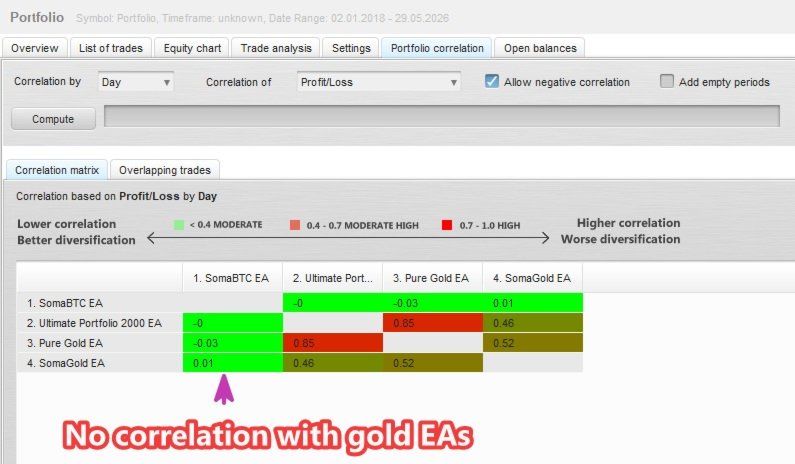
The developer’s historical matrix shows a correlation of 0.01 between SomaBTC and SomaGold in that research sample. That supports considering the two as different market exposures. It does not prove that a live combination will hold the same correlation or a lower maximum drawdown.
Setup and current maintenance
Use BTCUSD on MT5; the attached chart timeframe can be chosen freely because the EA reads its own timeframes. The developer recommends ECN/RAW pricing, $2,000 at default risk and stable VPS execution. Allow https://www.worldtimeserver.com/ in MT5 WebRequest settings for automatic GMT detection. Confirm the broker’s contract size, minimum lot, trading schedule and spread before transferring a test to live trading.
Recent dated release notes cover pending-order margin allocation, non-USD sizing and false-breakout exits. Earlier tests and dashboard images may therefore reflect earlier behaviour. Read the release notes.
Other EAs by Andrii Soma
- SomaGold MT5 product · SomaGold MT5 review
- SomaOil MT5 product — WTI crude oil; SomaOil review.
Each is a separate system, sold on its own, with its own strategy, settings and results. Running several together adds to your total exposure.
Verdict
The strongest reason to consider SomaBTC is its documented portfolio structure and practical execution controls. The Bitcoin live account remains the key caution: historical optimisation has not yet translated into a persuasive overall live gain.
View SomaBTC MT5 pricing and product details
MQL5 developer listing · Release notes
Offer: standalone file, with free lifetime updates. See the linked product page for current pricing.