
ChronomaX EA MT5 is a EURUSD averaging robot whose main attraction is control over grid spacing, volume and basket management. Our assessment: it is relevant to experienced grid users prepared to supervise exposure, while its documented drawdown makes it a poor match for someone seeking a low-risk, unattended system.
Ready to Buy ChronomaX EA MT5?
$239.96 with crypto · $299.95 by card
Official version · Instant download · Free lifetime updates · 7-day money-back guarantee

Evidence checked 27 September 2026. This review examines the developer’s public documentation, release notes, customer comments and the ShowMyTrades account supplied for ChronomaX. We have not traded or independently audited the executable. CheaperForex sells the standalone offer.
Why averaging changes the risk calculation
A grid can move its average entry closer to the current market by adding positions. That can make a smaller rebound sufficient to close the basket, but the apparent improvement comes with more open volume. A long run of small profitable baskets therefore says little by itself about the eventual size of a losing one.
For an illustrative three-position sequence of 0.01, 0.02 and 0.04 lots, total volume is 0.07 lots: seven times the first entry. This is explanatory arithmetic, not a ChronomaX preset or recommended setting. It shows why a buyer should assess the sequence’s total exposure, spacing and exit rule rather than judge risk from the first ticket.
The listing attributes entry timing to AI/ML. That is a developer description; the public material does not let us verify the model, training process or incremental benefit. It should not be read as evidence that the strategy can reliably anticipate the next adverse trend.
Inputs that deserve a demo test
The shared guide separates initial-entry news blocking from blocking further grid additions. It also documents commission/swap handling in basket targets, a drawdown stop, emergency margin protection and a non-grid mode with a pip stop. These are distinct choices; confirm their availability and configured values in the file you receive.
- Volume and spacing: watch how much aggregate exposure accumulates before the position limit is reached. Repeat under a prolonged directional move.
- Costs and exits: inspect whether the basket’s expected net result still makes sense after spread, commission and several rollover charges.
- News behavior: verify whether the chosen settings pause only a fresh basket or also prevent adding to one already losing.
- Loss handling: establish what closes, what remains open and whether trading resumes after a stop. Do not assume a named protection is active by default.
An entry filter cannot undo an existing position. Similarly, a maximum-position limit stops further additions but leaves the accumulated exposure sensitive to price. Gaps, disconnections and poor liquidity can also make an intended account-level exit differ from the realised loss.
The developer’s own warning matters
Jesper Christensen’s February 2026 risk article explicitly discusses complete account loss and accepting failed grid accounts. Its aggressive personal examples are not appropriate default setup instructions. In particular, do not use those examples to override the lower AutoLot ceiling stated on the ChronomaX listing.
Withdrawing profits can reduce money still exposed, but it cannot turn the remaining account into a protected investment. Separate accounts can also lose together if they are exposed to the same market shock. This review does not adopt the article’s projected returns or account-recycling approach as a recommendation.
What the supplied ShowMyTrades account establishes
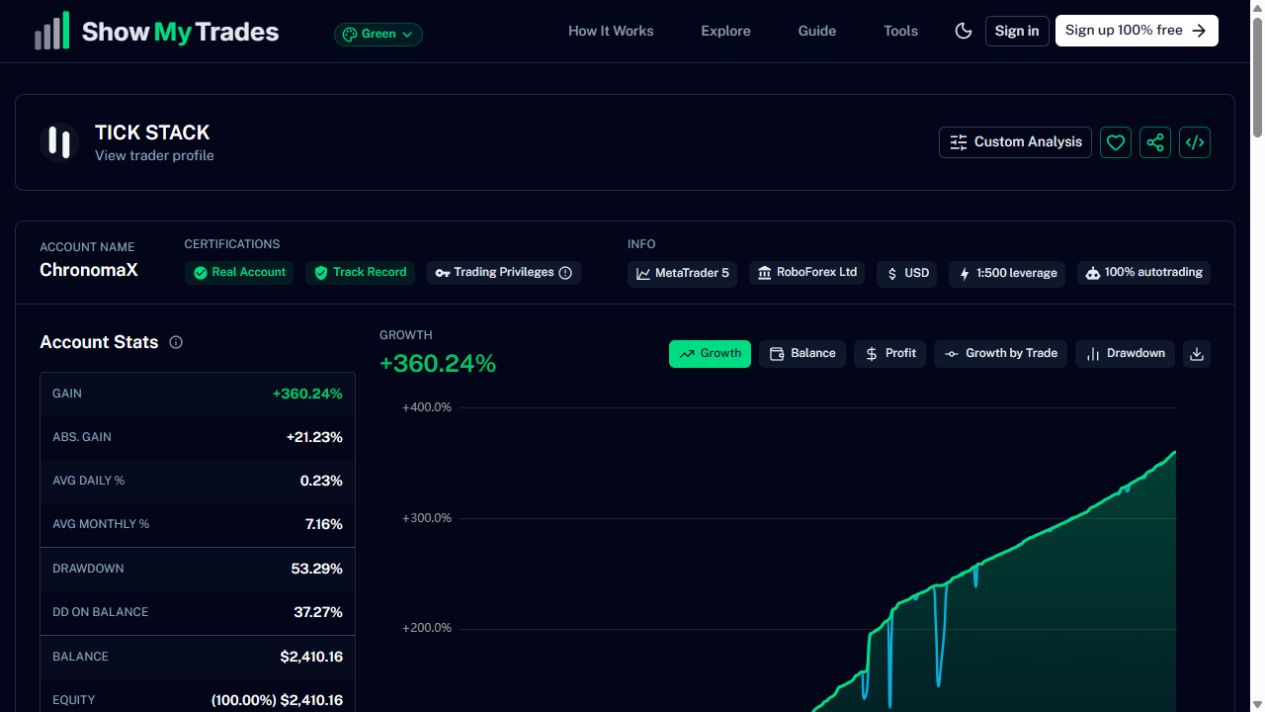
At the check, the MT5 RoboForex-Pro record showed +360.24% time-weighted gain and 53.29% equity drawdown, with 880 trades and a 1.70 profit factor. Real Account and Track Record badges were green; Trading Privileges was grey. These observations are about the public record, not proof that every trade came from the same retail build or settings.
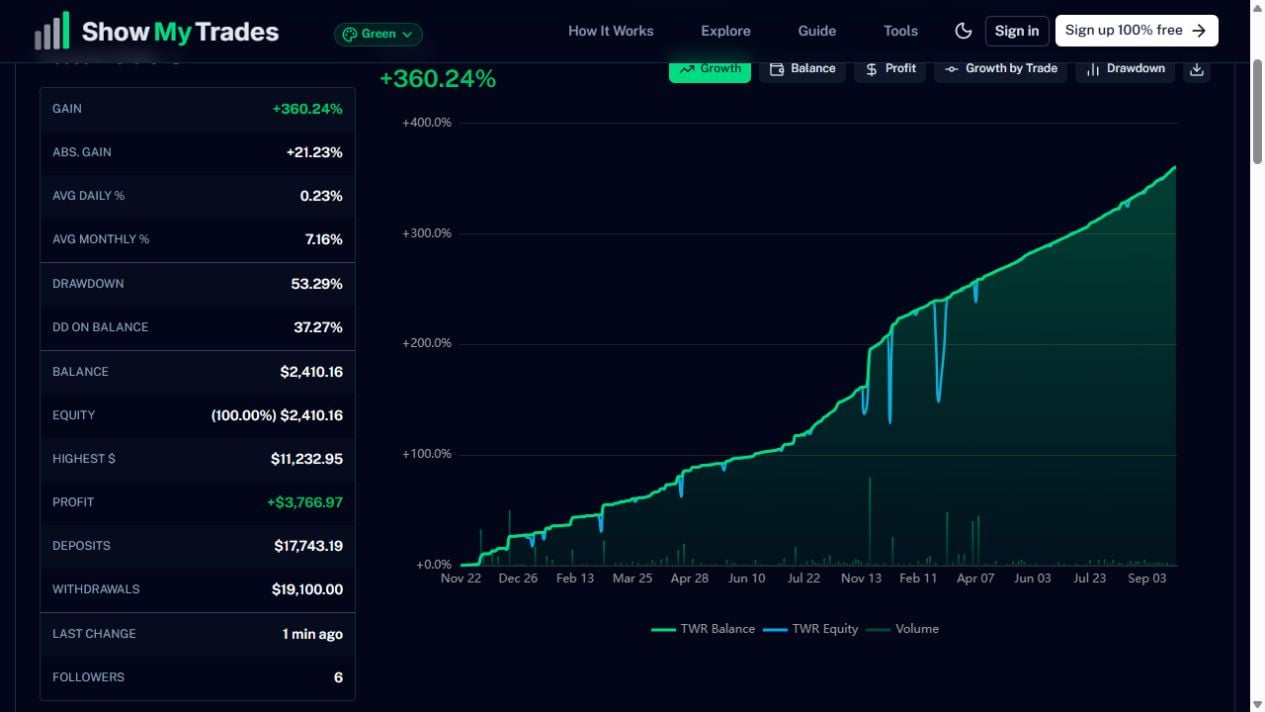
The displayed balance and equity were $2,410.16, with deposits of $17,743.19, withdrawals of $19,100 and net profit of $3,766.97. History rows began in November 2024 and the most recent visible closes were dated 24 September 2026. We could not establish a monitoring-start date.
Why gain and cash profit are different
ShowMyTrades defines time-weighted return by compounding cash-flow-adjusted daily returns. Its absolute-gain measure compares net closed profit with total deposits; here that figure was +21.23%. The much larger TWR headline therefore must not be read as the percentage cash profit earned on every deposited dollar. Depositing and withdrawing at different times changes the relationship between those measures.
The cash totals provide a useful arithmetic cross-check: deposits plus net profit minus withdrawals equal the displayed balance. That consistency does not independently audit the underlying transactions, but it prevents confusing the withdrawal total with trading profit.
Equity losses deserve equal prominence
A 53.29% drawdown is a fall of more than half from the reference peak. Purely as arithmetic, recovering from such a percentage loss requires roughly 114% growth on the remaining capital. That is why the equity path matters even when the closing balance curve looks smooth.
There is a source inconsistency: the selected Drawdown chart headline showed 48.54%, while the statistics panel stated 53.29%. We retain the higher equity statistic and have not established the reason for the difference. The site’s AI commentary also referenced older counts; the figures above come from the current panel.
Verification is not a strategy audit
The provider explains that track-record verification concerns read-only broker access, whereas trading-privileges verification concerns account control. Neither badge certifies the EA’s logic, predicts its durability or proves the offered file generated the whole record. The grey privileges badge is a limitation to disclose, not evidence of misconduct. ShowMyTrades is an analytics service; this link is not a purchase of copy-trading execution.
Original backtests: read the equity fields
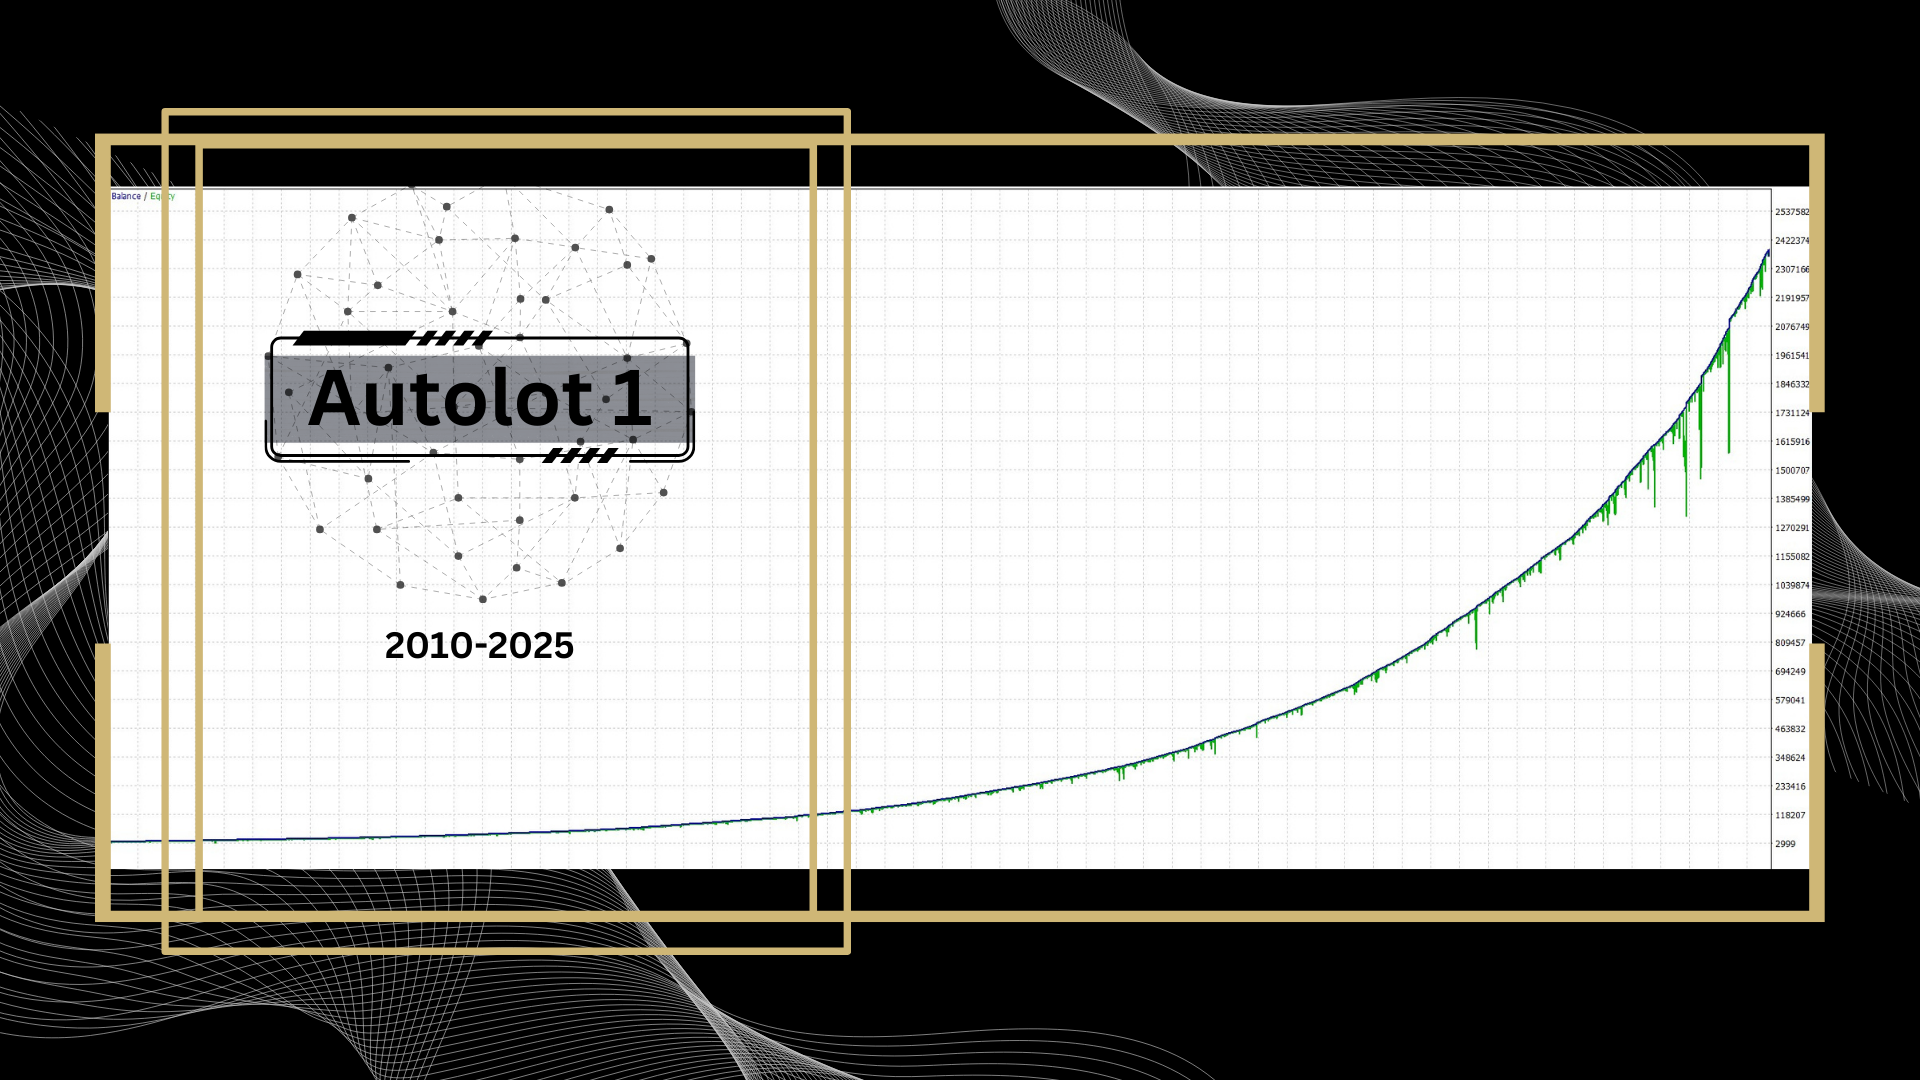
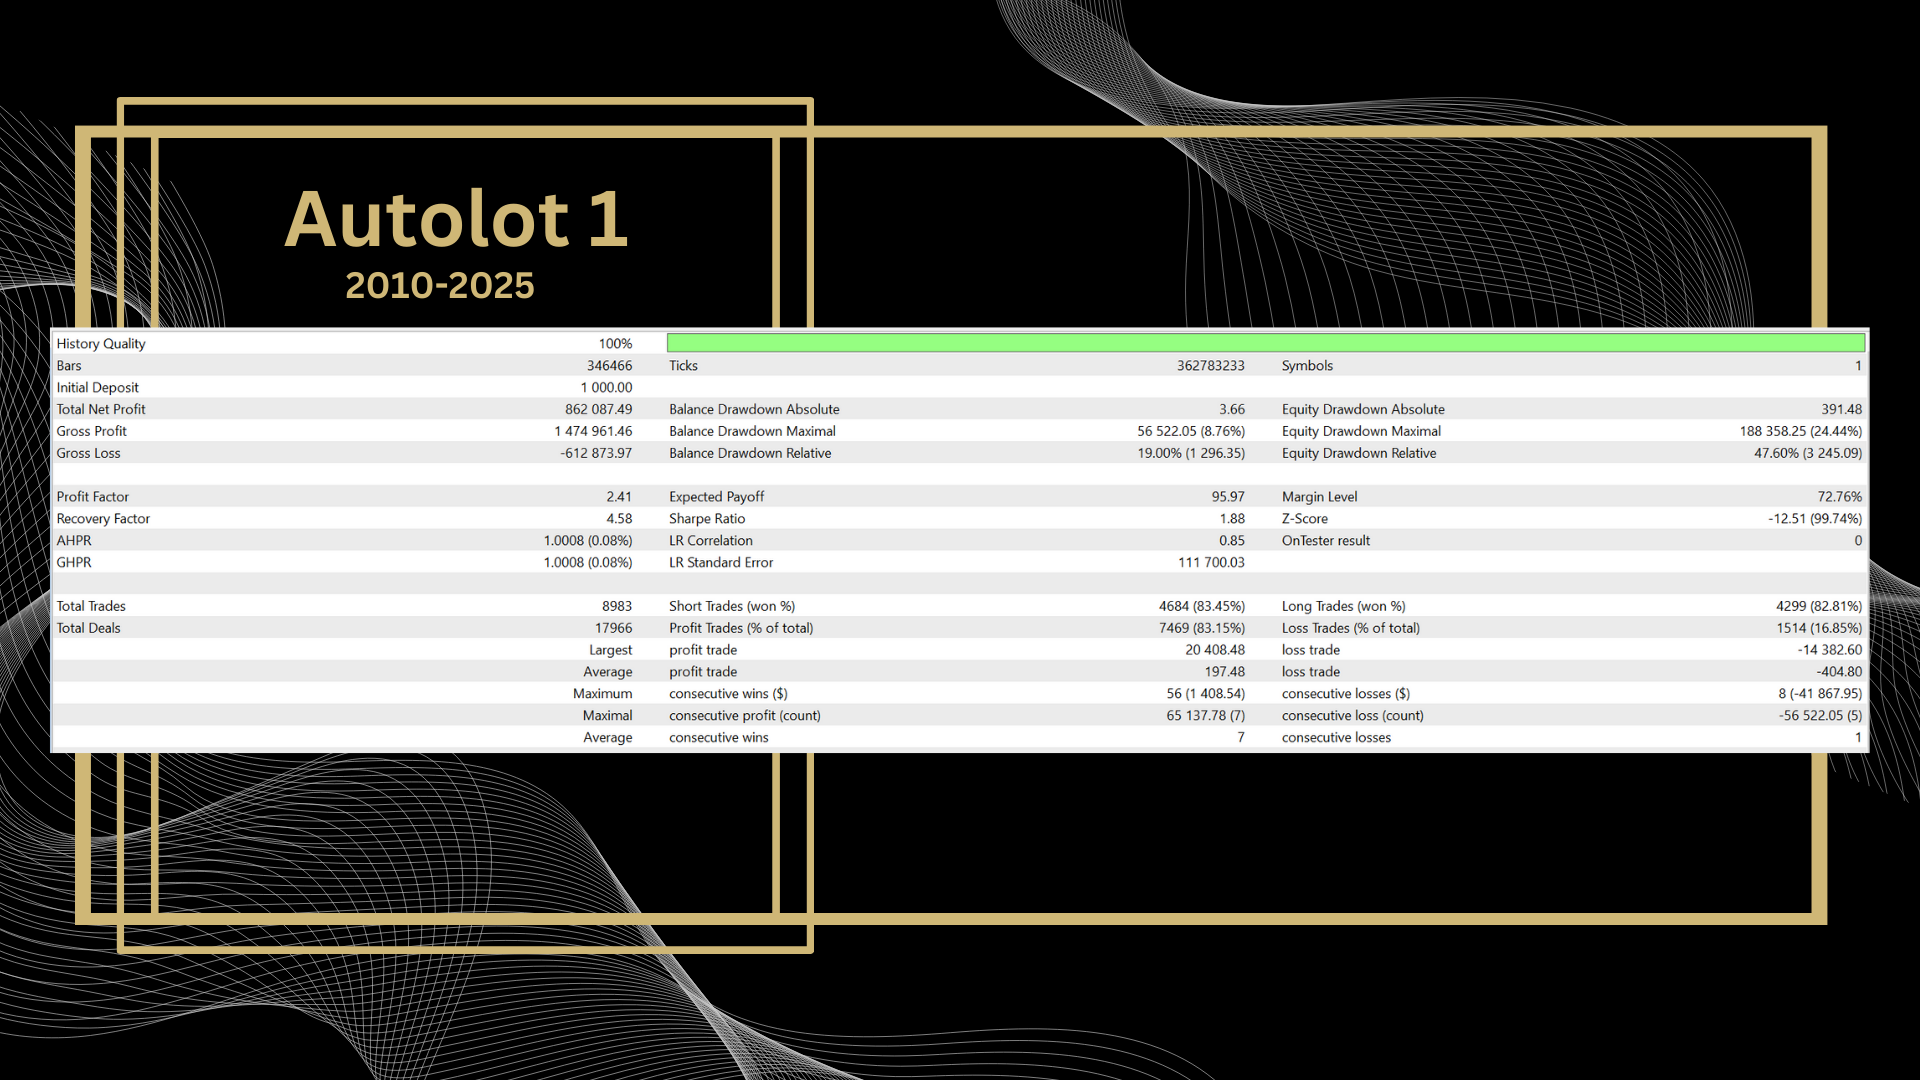
The AutoLot 1 report states 47.60% relative equity drawdown. The smaller 24.44% beside its maximal-equity figure is a different field and should not substitute for that percentage. The curve’s endpoint and the report’s profit do not establish a matched run, so we do not combine them into a single verified result.
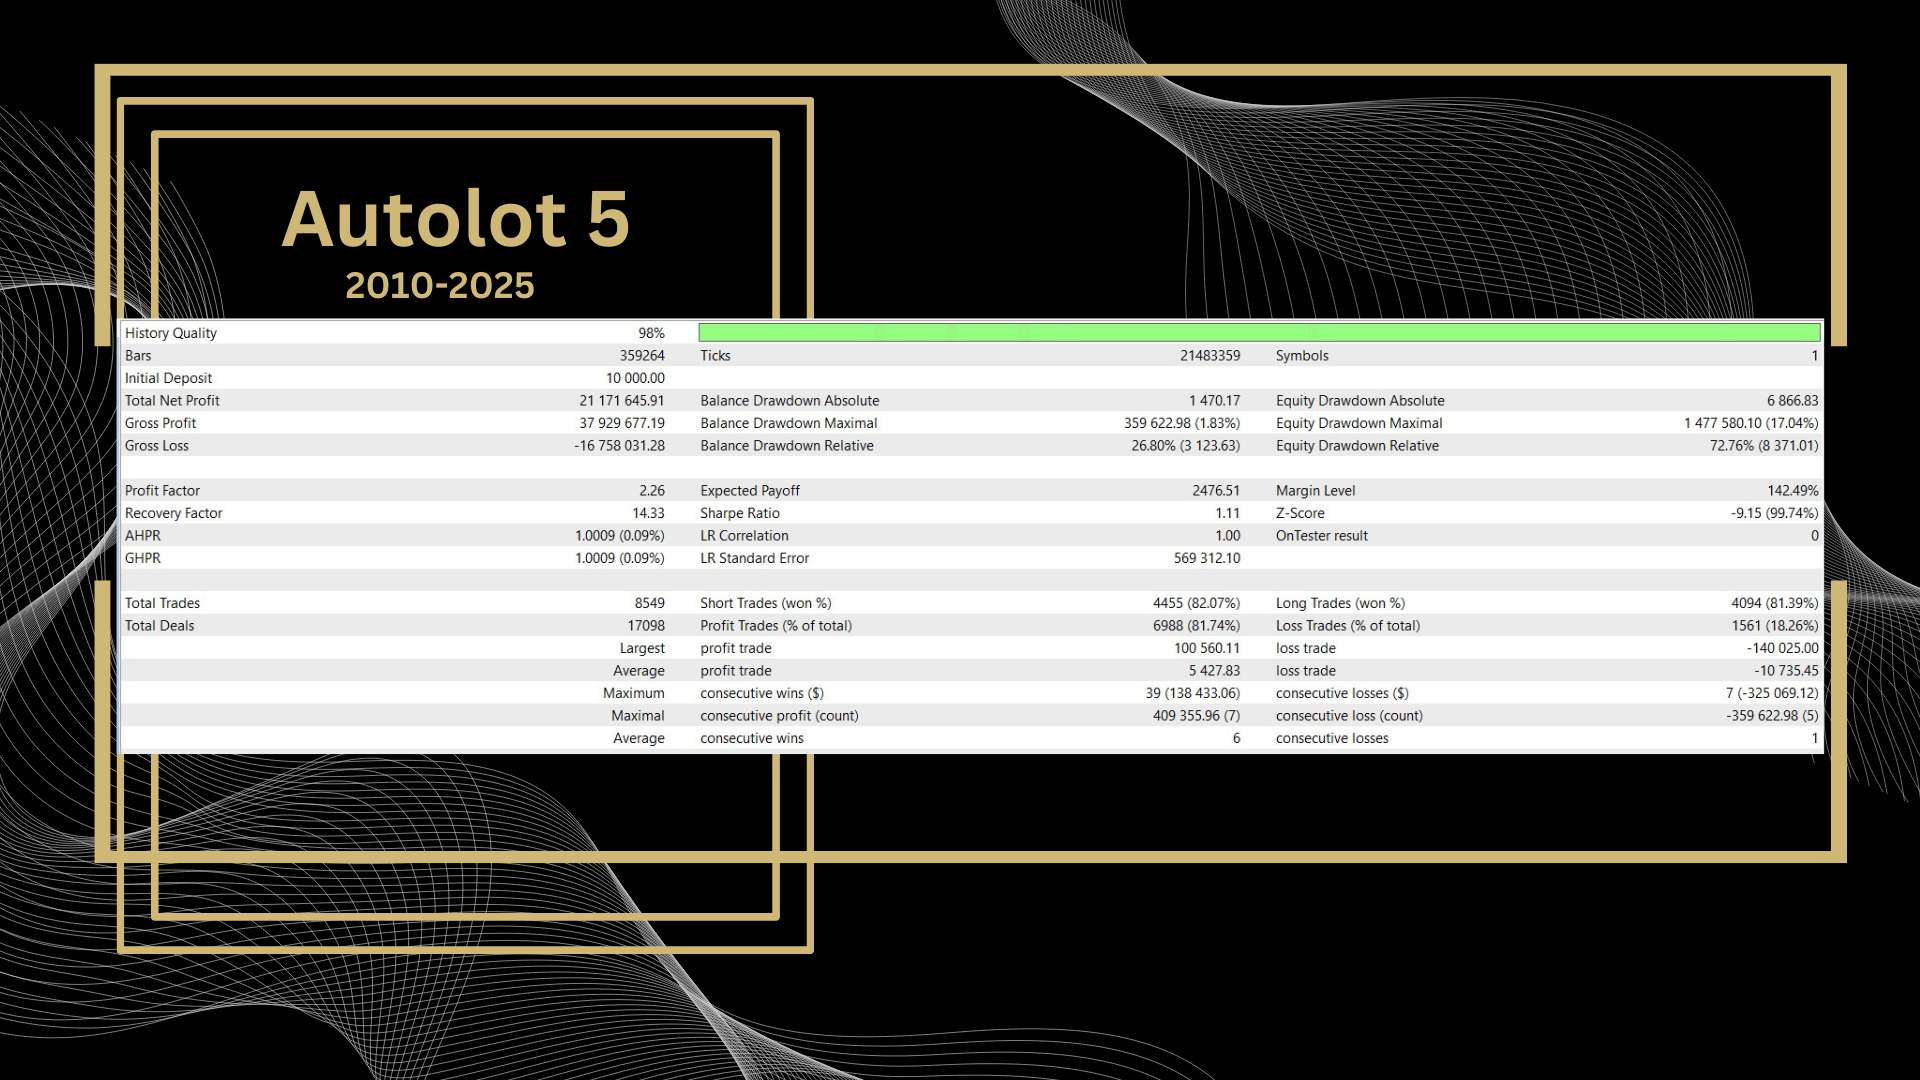
The AutoLot 5 report has 72.76% relative equity drawdown. Its starting deposit, trade count and history-quality figure also differ from the AutoLot 1 report. This is not a controlled experiment changing only one parameter; it is useful evidence of how severe the illustrated losses can become.
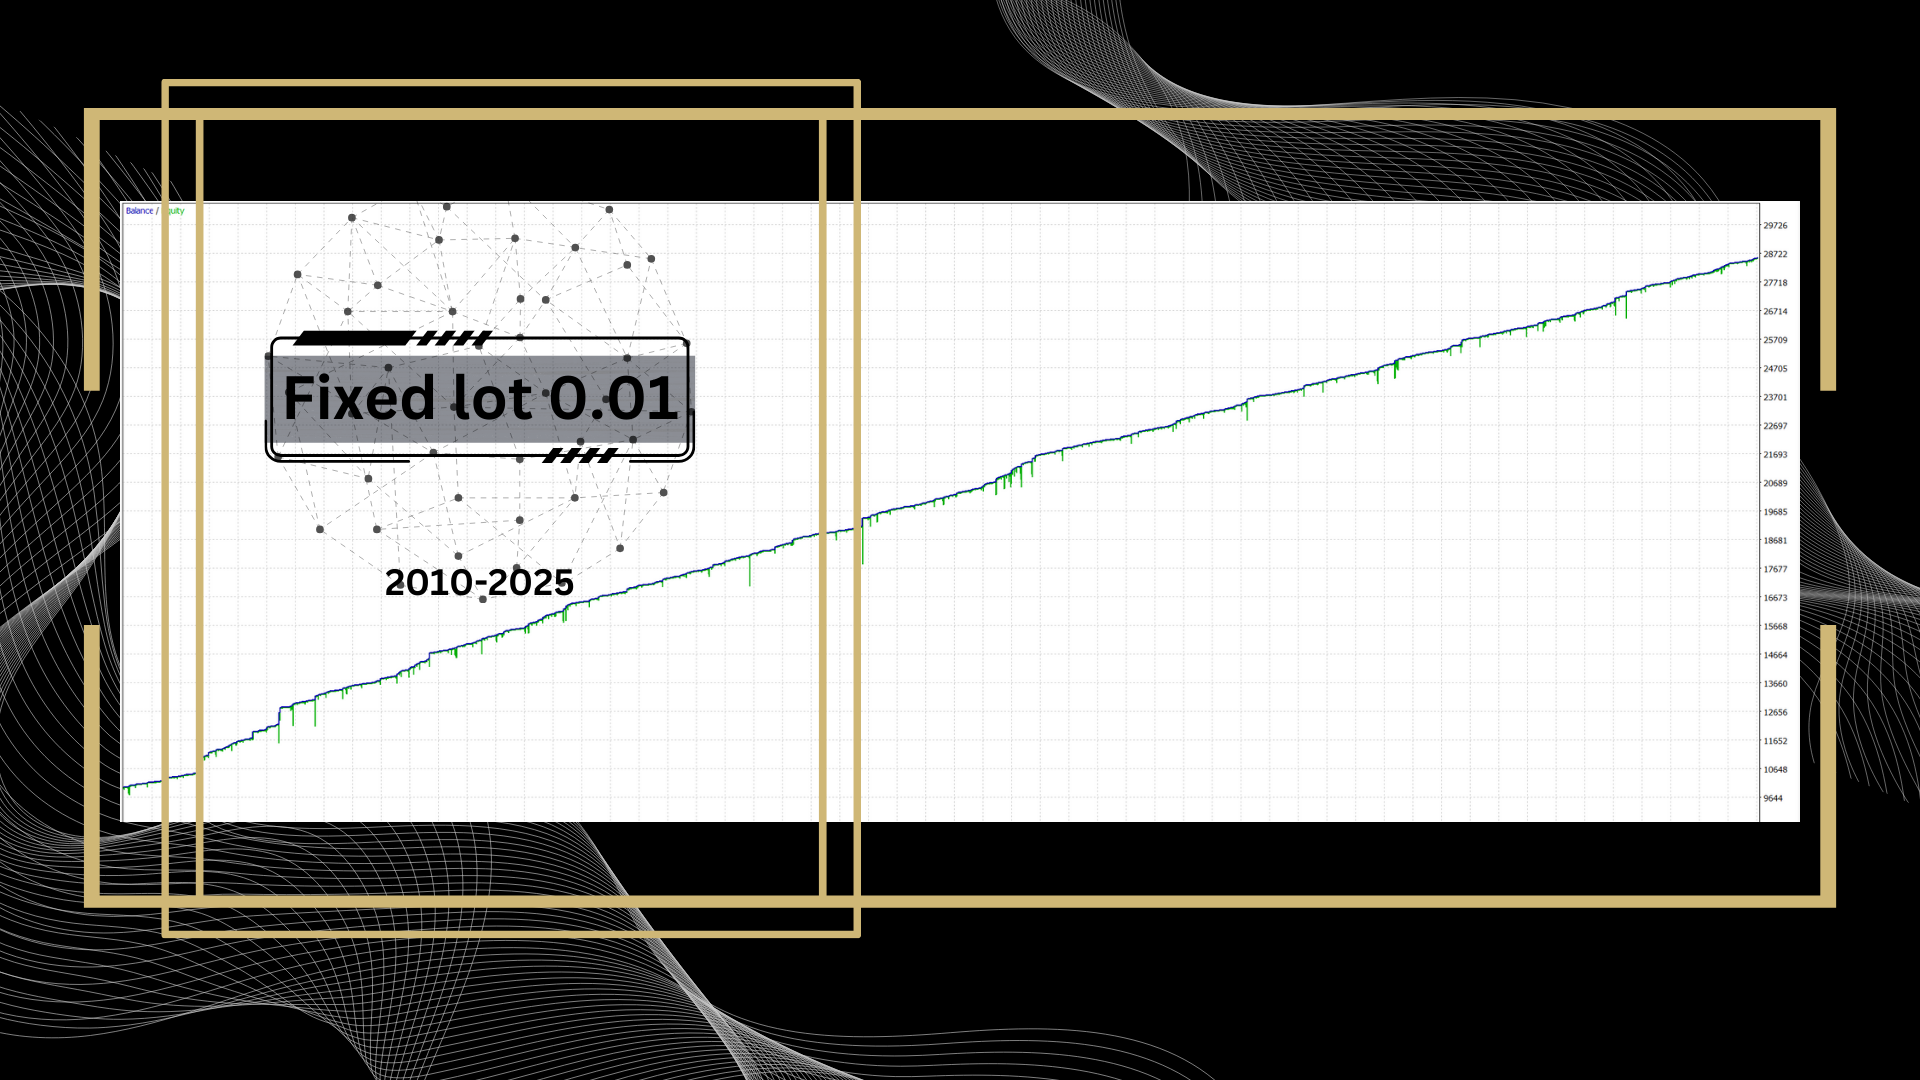
The fixed-lot image offers a further sizing contrast. Keep chart scale and compounding in mind: the visual steepness of curves on different vertical axes does not rank their risk-adjusted quality. We have not reproduced these simulations. The developer’s tick-data guide is linked below for readers who want to inspect the testing process themselves.
Customer feedback and release context
The MQL5 feedback includes praise for support and grid handling, alongside a reviewer’s observation that supervision or intervention can be necessary. Those are individual customer opinions, not CheaperForex verified-purchase ratings or an independent performance test.

Tomasz W’s brief comment is positive, but it does not supply account statements, settings or an equity history. A claim about profitable months also leaves unanswered how much floating loss occurred within each month. Read it alongside the account’s drawdown, not as a promise that every future month will be positive. Read the original MQL5 review.
The source listed developer release 3.71, dated 15 March 2026, at this check. That date describes the MQL5 release history, not a promise that a standalone file or future update is available here on the same day. The linked public guide explains a shared interface across several TickStack systems; product-specific instructions and the actual inputs still need to be checked.
Who should consider ChronomaX?
Its appeal is a focused EURUSD strategy with explicit ways to inspect and adjust basket behavior. It requires a trader willing to decide in advance how much volume and loss to tolerate, then monitor whether live execution matches that plan. A buyer who needs a demonstrated low-drawdown record, guaranteed funded-account eligibility or completely unattended operation should not infer those qualities from its marketing.
For another grid approach across different currency pairs, our Boring Pips MT5 review provides a useful comparison of exposure and evidence. It is a different developer’s system; the records are not a controlled comparison of returns.
Verify it yourself
- ChronomaX MQL5 specifications and customer feedback.
- TickStack shared grid-system user guide and the developer’s grid-risk explanation.
- ChronomaX public trading record on ShowMyTrades.
- ChronomaX developer release history.