
Philosopher trades gold through a collection of entry models and a common recovery engine. The appeal is the ability to select a strategy mix and supervise its exposure from one dashboard. The central consideration is what happens after an entry goes wrong: a growing basket can matter more to the account than the number of different signals.
Our assessment: a configurable option for traders who understand recovery trading and want to inspect their settings closely. Early public results are encouraging, but the available record is short and the original promotional graphics contain date inconsistencies. They do not establish long-term robustness. CheaperForex sells this EA; this review examines public evidence rather than reporting an independent forward test.
Get Philosopher EA MT5 at CheaperForex
Ready to Buy Philosopher EA MT5?
$119.96 with crypto · $149.95 by card
✅ Selectable XAUUSD strategies and broker presets
✅ Agora dashboard for basket exposure and risk controls
Official version · Instant download · Free lifetime updates · 7-day money-back guarantee

What multiple strategies can and cannot diversify
Entry diversity can reduce dependence on one signal pattern. It does not remove shared market exposure. Two gold strategies may start trades for different reasons and still lose during the same sustained move. A useful evaluation therefore records simultaneous baskets, total lots and floating loss, rather than assuming that more named strategies automatically creates a safer portfolio.
Preset selection is part of that evaluation. Compare a chosen configuration with a smaller strategy subset using the same broker data and sizing assumptions. Look for the source of any improvement: fewer overlapping positions, different entry timing or simply lower volume. This is more informative than selecting whichever combined curve ends highest.
Why the recovery sequence deserves attention
Using the developer’s stated 1.5-times progression, a purely illustrative five-order sequence is 1, 1.5, 2.25, 3.375 and 5.0625 units of the starting order. Together that is about 13.19 starting-order units, before broker rounding, caps or separate hedges. This arithmetic illustrates how quickly volume can accumulate; it is not a prediction of the exact orders placed by a particular preset.
Basket exits also complicate a headline win rate. An individual losing order can belong to a basket that closes positively, while a rare failed recovery can outweigh many profitable exits. When checking results, keep trade-level statistics alongside the account’s equity path and the largest periods of open exposure.
The developer-linked public account
At our 24 September 2026 check, ShowMyTrades labelled the account real and displayed Track Record and Trading Privileges certifications. It showed MetaTrader 5, RoboForex-Pro, USD and 1:2000 leverage. These are the monitoring service’s account labels, not an audit by CheaperForex of the EA, broker or configuration.
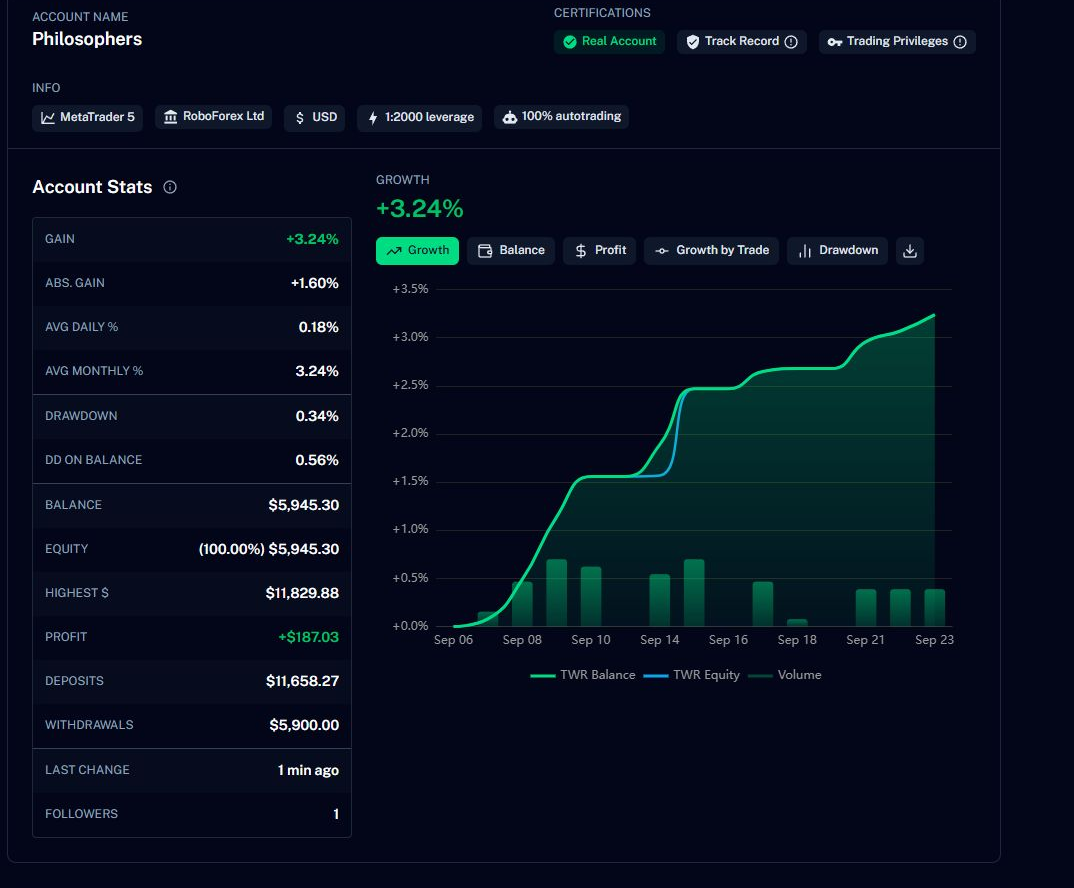
- Displayed growth
- +3.24% time-weighted gain; +1.60% absolute gain.
- Balance and equity
- $5,945.30 each, with no open positions displayed at the check.
- Cash flows
- $11,658.27 deposits, $5,900 withdrawals and $187.03 profit.
- Closed trades
- 50, comprising 48 winners and 2 losers; 4.39 profit factor.
- Displayed drawdowns
- 0.34% equity drawdown and 0.56% balance drawdown, using the service’s separate measures.
The deposits and withdrawals make simple comparisons between the closing balance and total deposits misleading. Likewise, time-weighted and absolute gain are different measures and should retain their labels. Visible trade history begins on 7 September 2026 and the displayed monthly performance covers September. This is an early observation, not a multi-year record; the first visible trade date does not establish when monitoring began.
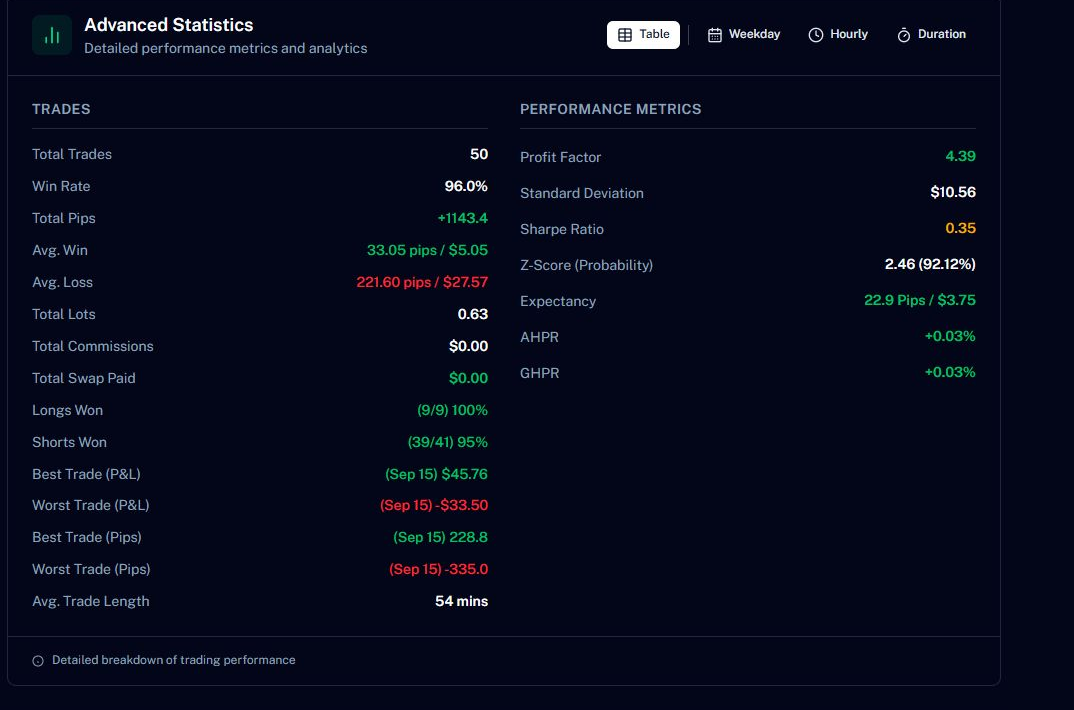
The average winner was $5.05 and the average loser $27.57: one average loss consumed roughly five and a half average wins. That relationship helps explain why a 96% win rate needs context. Only two losing trades underlie the average-loss estimate, so a more difficult recovery could materially change it. The observed drawdown is also not a forecast of the next drawdown.
What the gallery actually demonstrates
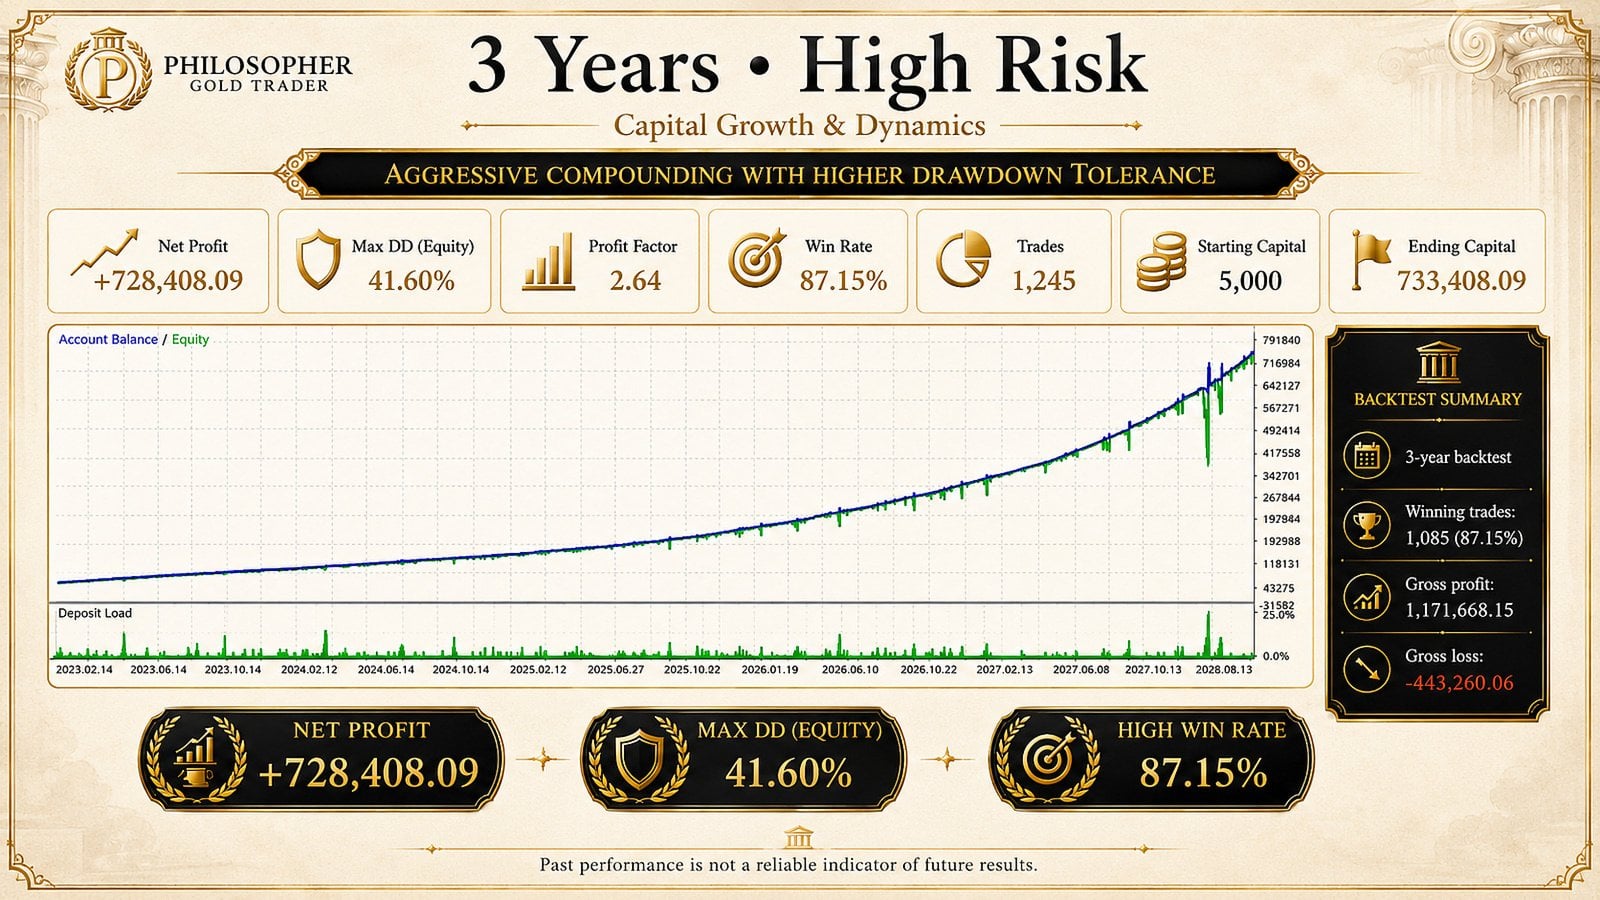
The high-risk graphic displays 41.60% drawdown, a 2.64 profit factor and a $5,000 start. However, its chart runs from February 2023 to August 2028 while the heading says three years. That internal mismatch prevents treating the pictured period as a validated historical simulation. It is a promotional summary, not an original Strategy Tester report with inspectable settings and data assumptions.
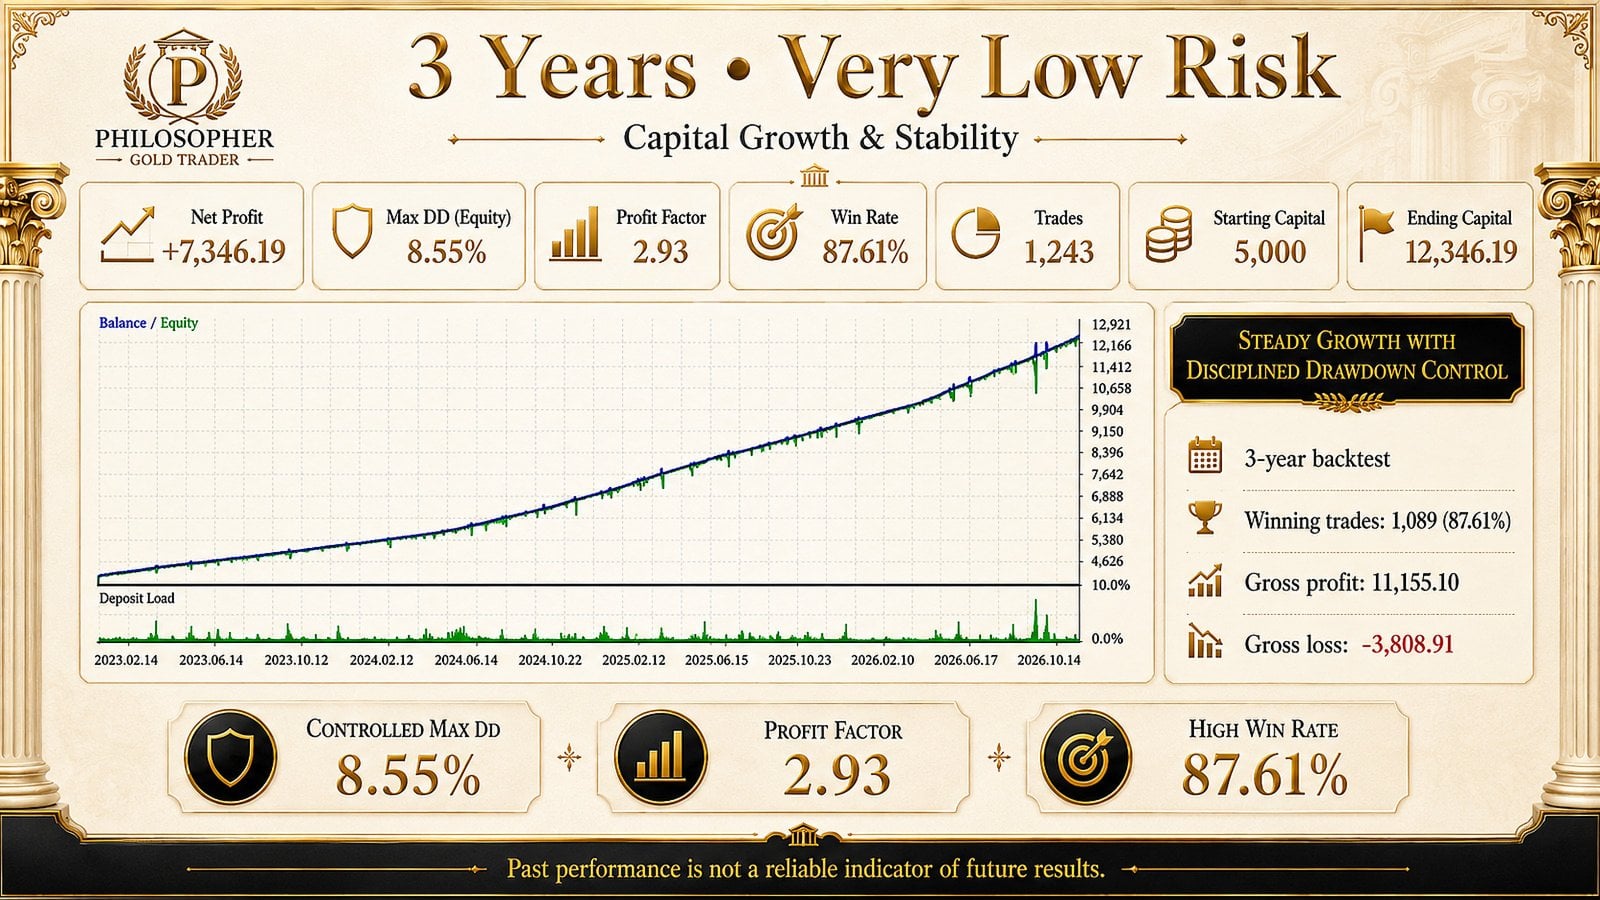
The lower-risk graphic displays 8.55% drawdown and a 2.93 profit factor, again from $5,000. Its axis ends in October 2026, which was still in the future at our check. We therefore cannot validate the claimed period from the image. Neither graphic proves how the current supplied build will perform.

The older strategy-count label is another reason to retain the distinction between original artwork and current specifications. A useful independent test would record the build, preset, strategy selection, broker data and exact date range together. Without those details, the gallery supports recognition of the product and its marketing history, not a reproducible performance claim.
Recent changes affect how the evidence should be read
The September release notes describe cent-account sizing fixes, a calendar fallback, news-coverage safeguards and changes to presets and strategy selection. The latest dated notes also set a default drawdown trigger of 20%. That is an instruction for the EA to act, not a guaranteed realised-loss ceiling.
Such changes are useful operational information, but they also mean early comments and screenshots may reflect different settings or behaviour. Check the dashboard’s news status, the selected action after a drawdown event and the resulting order sizes after any configuration change. Preserve the settings used with each test so later comparisons remain meaningful.
Customer feedback is positive but early

The visible feedback includes praise for early performance and the developer’s responsiveness. One September reviewer explicitly describes only a week of use; another discusses confidence built through the developer’s other software. A rating without written detail adds no explanation of settings or results. These comments are useful for understanding initial user experience, but they do not establish behaviour through a prolonged adverse market.
Who is it for?
Philosopher is most relevant to an MT5 gold trader willing to examine basket exposure, test a specific configuration and follow its news and sizing diagnostics. Someone requiring single-entry trading with no recovery grid would be looking for a different operating model. The clearest next step is to inspect the public account and test the intended settings rather than judge it from a promotional return figure.
How to get Philosopher EA MT5
Get Philosopher EA MT5 at CheaperForex for current pricing, the standalone offer and purchase support. Review the product’s delivery details and guarantee before ordering.
The MQL5 marketplace listing is the developer reference for features and release information. It is also a separate purchase channel with its own delivery and licensing terms.
Verify it yourself
- Official listing: Philosopher features on MQL5.
- Public account: Philosopher results on ShowMyTrades.