
TitanForge EA MT5 targets gold momentum on an hourly chart, pairing selective entries with individual stops and trailing exits. Its clearest appeal is to traders looking for an alternative to recovery grids. Our assessment is that the controls are worth testing, but the public evidence is too young to treat the advertised growth as a dependable expectation.
View product details and current pricing.

Evidence checked: 24 September 2026. This is an analysis of Maxim Kurochkin’s public listing, original gallery, linked MQL5 account and buyer feedback. We have not run TitanForge ourselves. The product was published on 20 September, so a long research curve should not be confused with a long public retail track record.
How to judge its entry and exit design
For a momentum strategy, the important question is what happens when a promising move stalls. TitanForge describes hard stops and profit-following protection rather than averaging into a losing basket. That provides a defined exit mechanism, but says nothing by itself about how reliably an entry anticipates follow-through.
The published defaults put the stop farther from entry than the profit target. Consequently, a high percentage of winners is not sufficient evidence: examine the cash size of losing trades, commissions and trailing exits together. Broker point values differ, so transferring a points-based configuration without checking the symbol specification can change the financial risk.
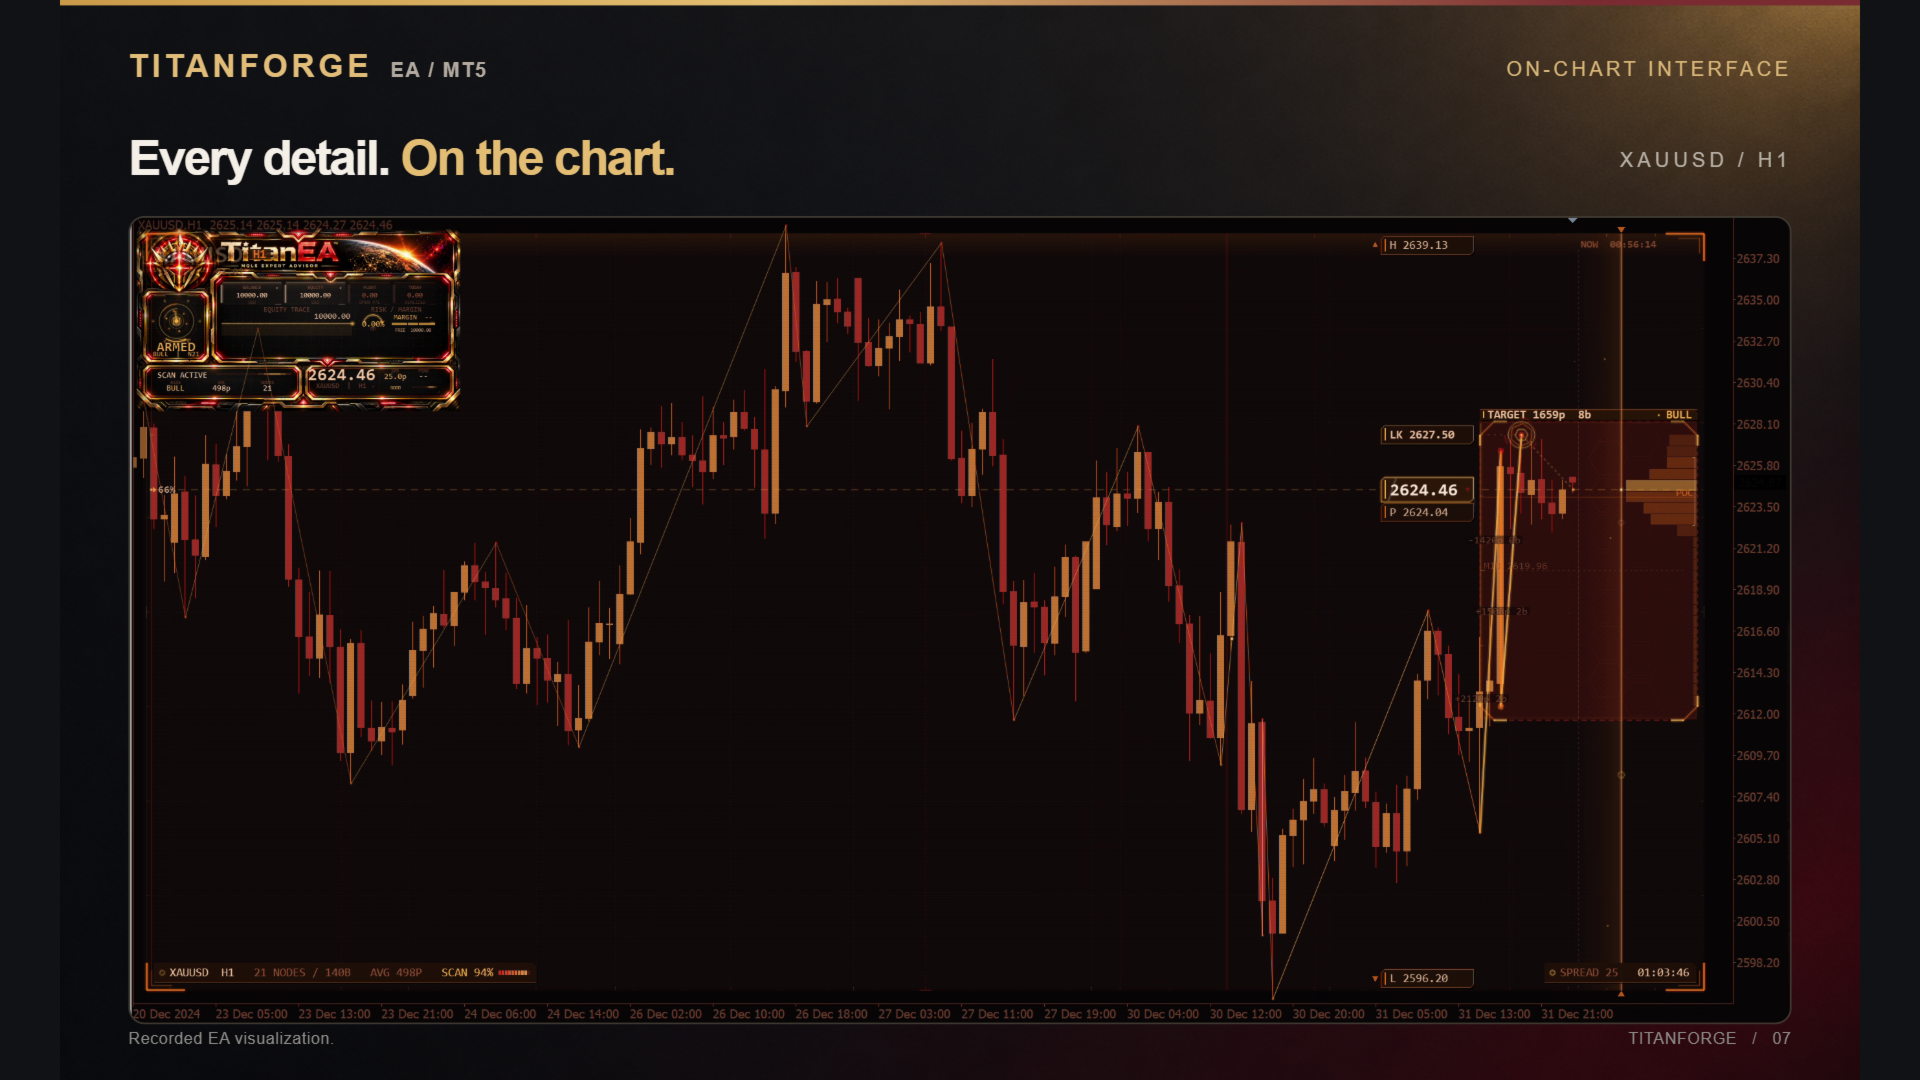
The image shows the developer’s recorded chart interface. Its status, spread and trading-level displays can assist supervision; they do not establish that every labelled chart opportunity becomes a profitable executed trade.
Public signal: large growth, only ten trades
Our check of the linked MQL5 account showed 296.31% growth, $14,815.55 profit and $19,815.55 balance/equity from a $5,000 initial deposit. MQL5 labelled it a real account on InstaForex-Server at 1:200 leverage. No later deposits or withdrawals were shown.
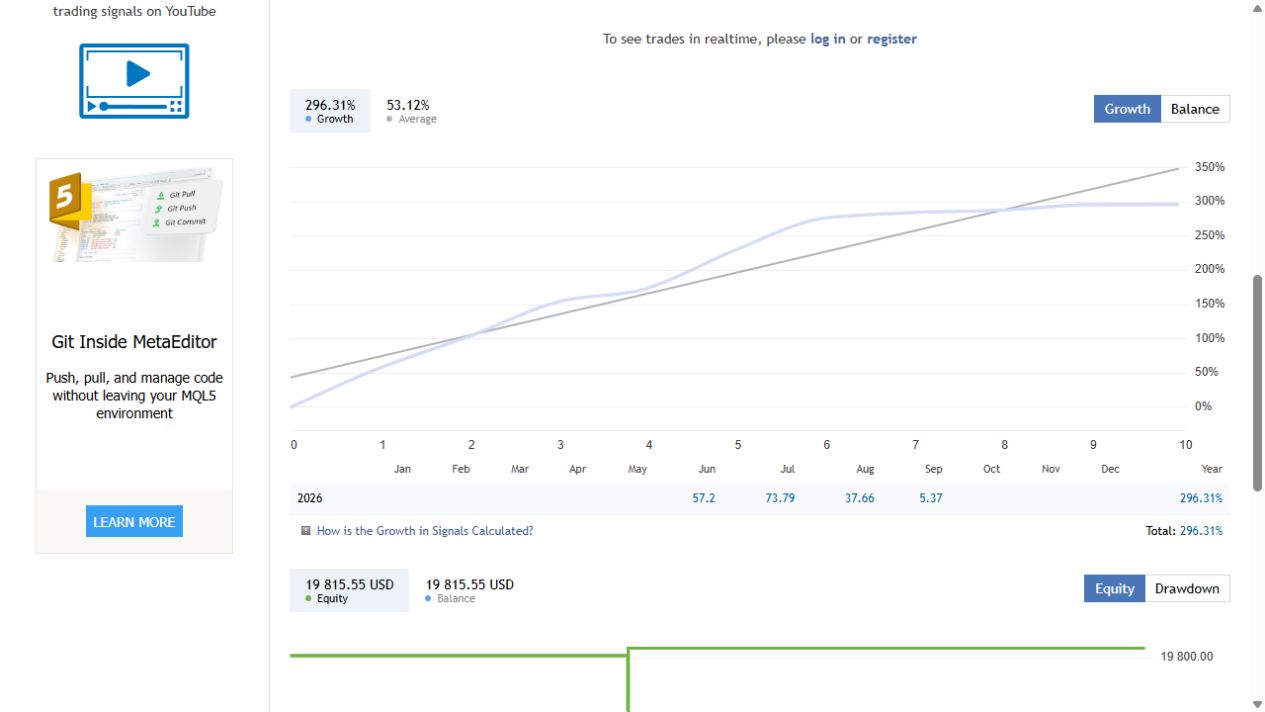
The decisive limitation is the sample: ten closed gold trades, all classified as profitable, across thirteen displayed weeks. The page’s monitoring start was 20 September 2026, only four days before this check. Its activity tooltip also described roughly three and a half days of monitoring. Imported account history is not the same as months observed continuously by the service.
This differs from the developer gallery’s twenty-three-week claim. We therefore use the current account’s displayed dates and do not present the promotional duration as verified. MQL5 itself warned that there were too few deals to evaluate trading quality. A 100% win rate across ten trades does not reveal how the system responds to an extended losing period.
Relative equity drawdown was 14.07%, with maximum deposit load of 10.22%. Equity drawdown captures floating losses that can be obscured by a smooth closed-balance curve. It should be read alongside the trade history and selected risk settings, not replaced by the much smaller balance drawdown field. These are dated observations, not maximum future loss limits.
Two backtests, two risk profiles
The gallery separates a 2020–2026 maximum-risk run from a 2025–2026 run labelled Risk 4. Keeping those configurations separate matters: comparing their headline profits without the starting balance, position sizes and exposure would be misleading.
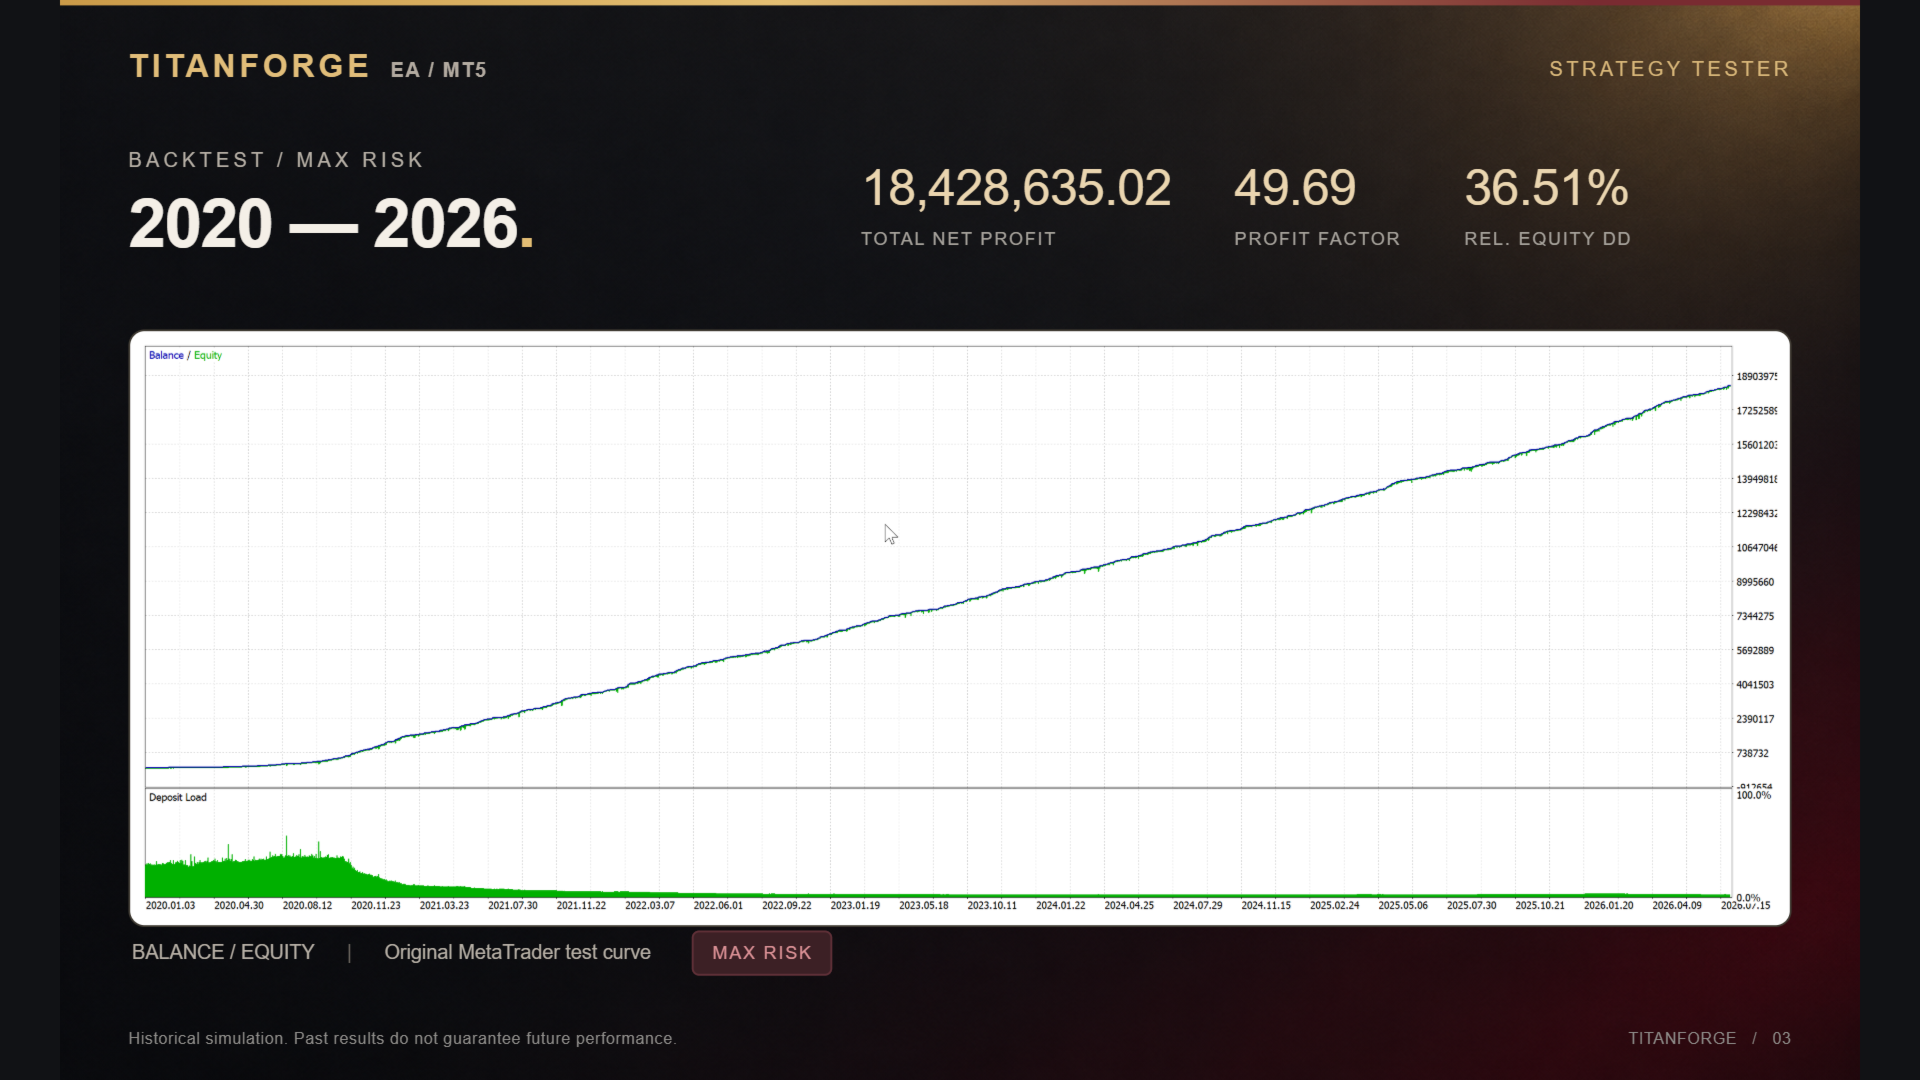
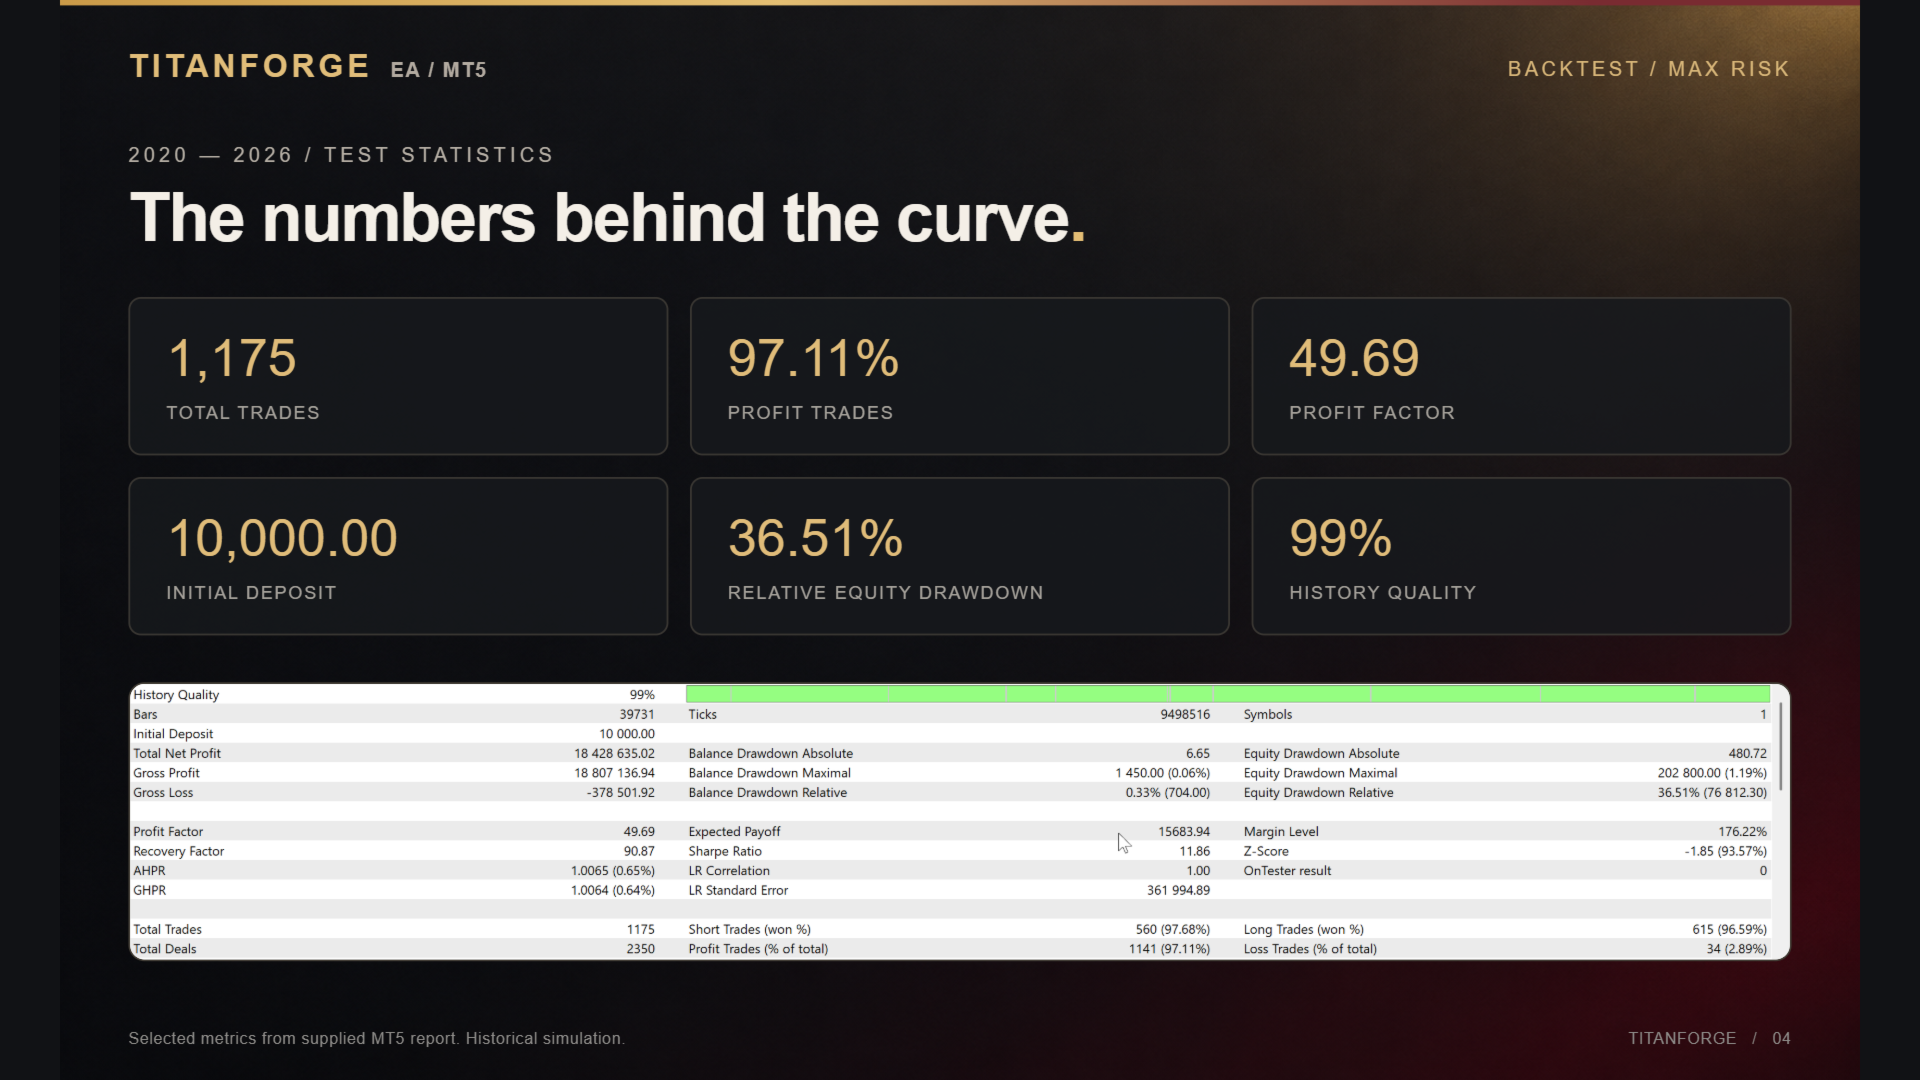
The longer simulation reports 1,175 trades and 36.51% relative equity drawdown. Its near-continuous upward balance line should not distract from temporary equity losses. The appropriate next step is to reproduce the intended lower-risk configuration with your own broker’s costs and inspect its worst sequences, rather than projecting the displayed final balance forward.
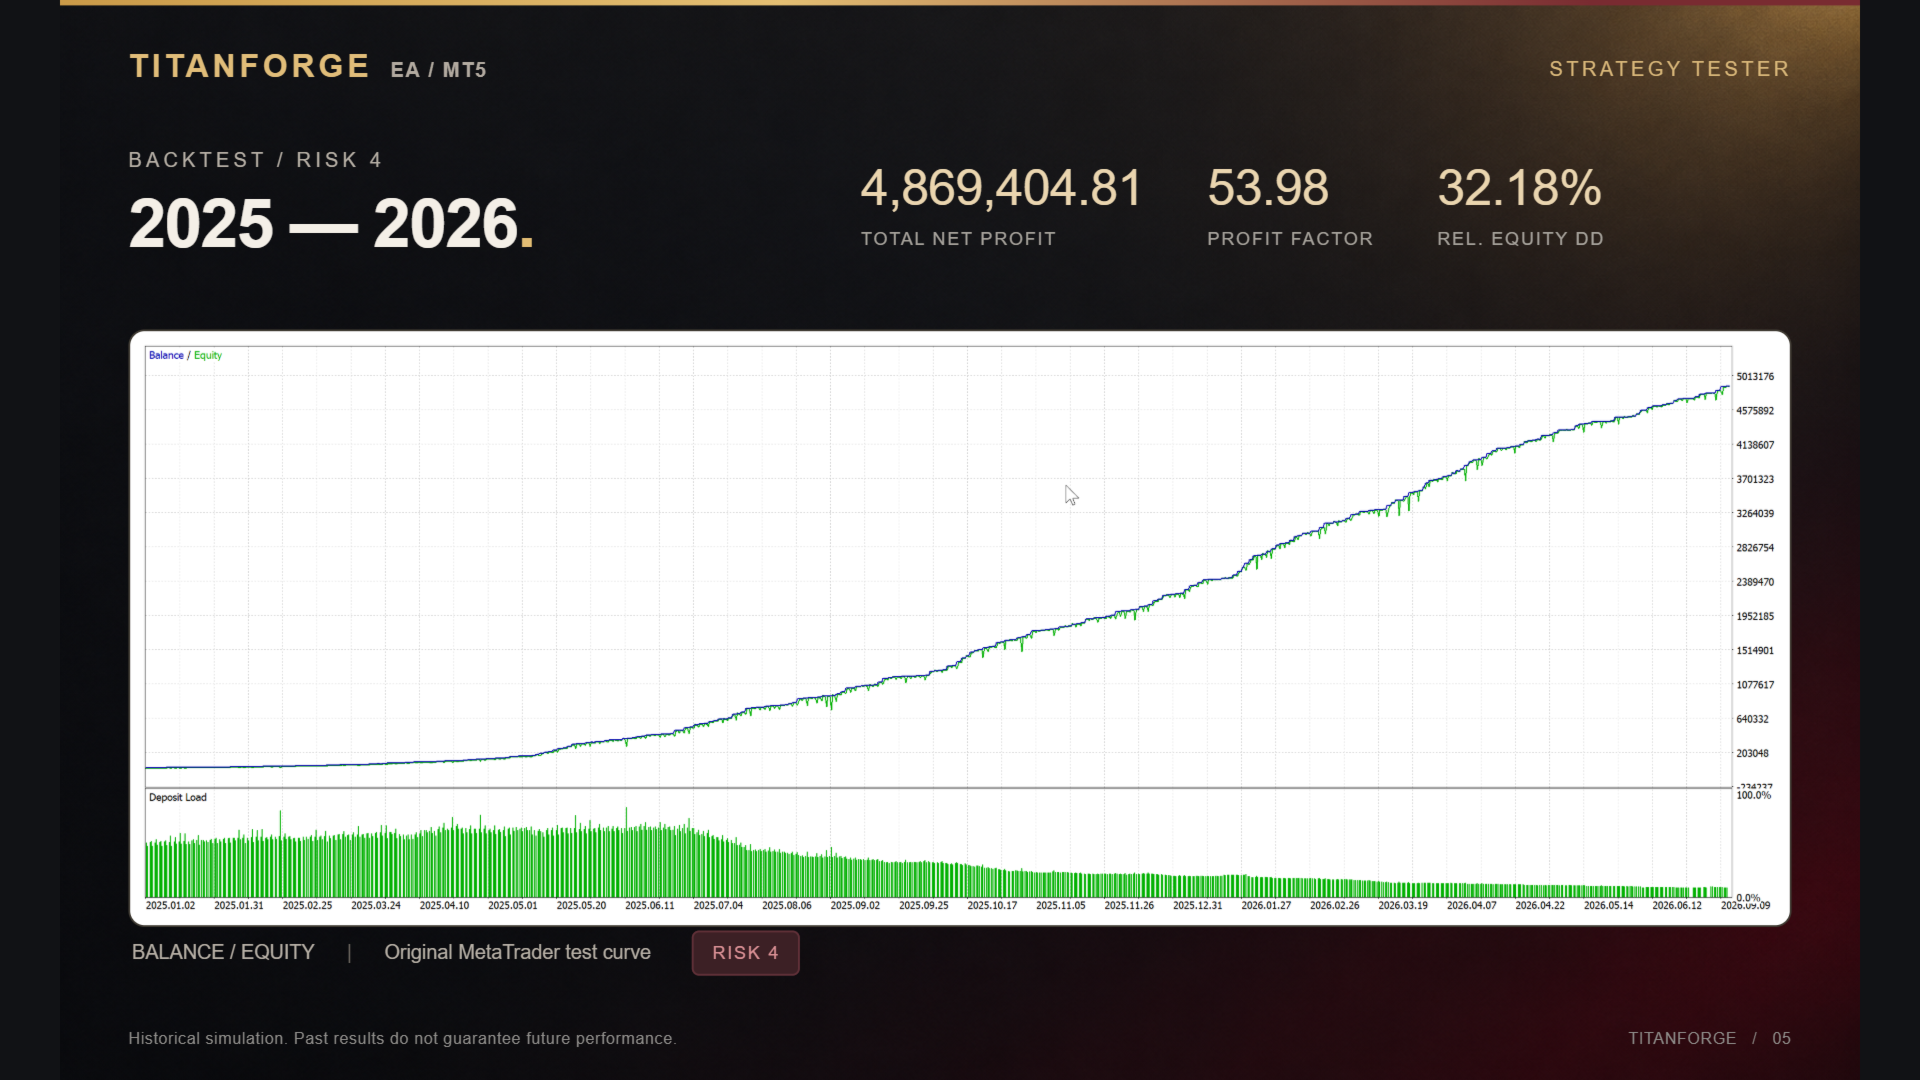
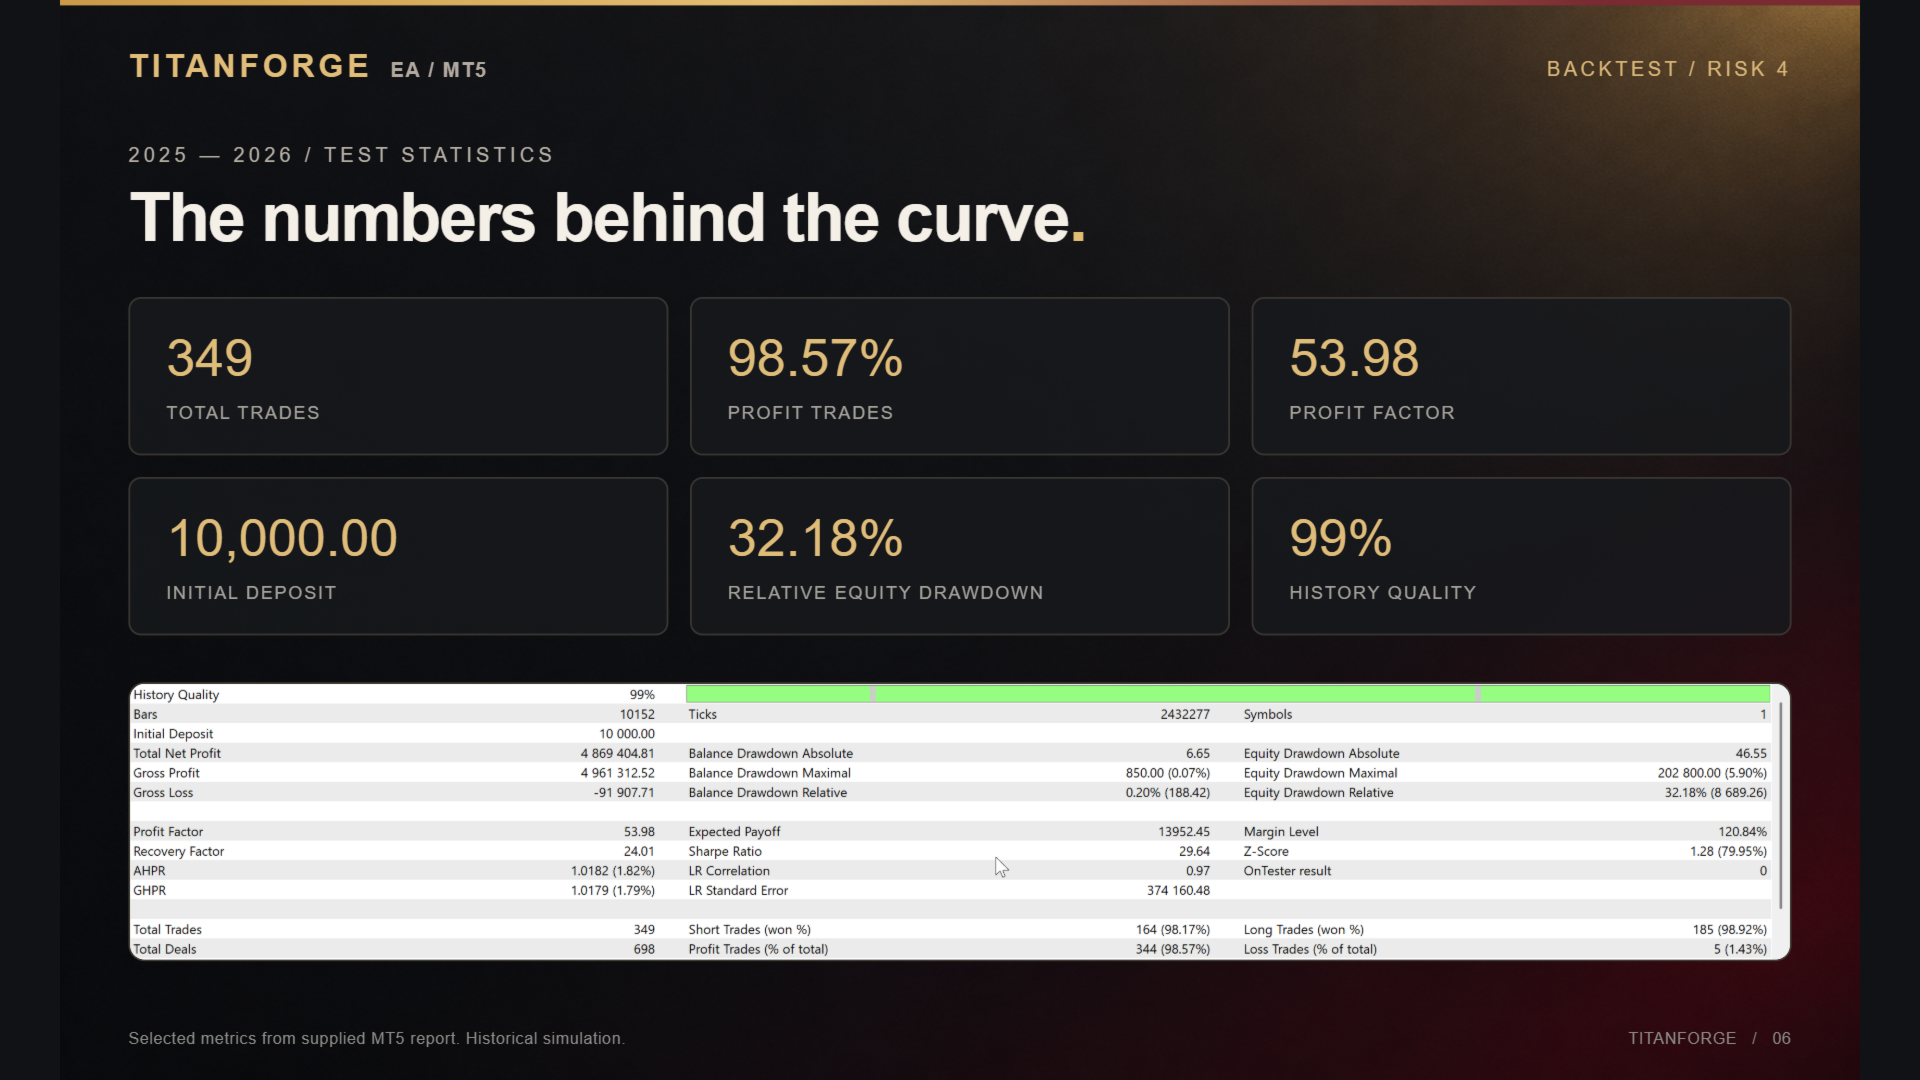
The shorter simulation reports 349 trades and 32.18% relative equity drawdown. Both are developer-supplied tests. A history-quality percentage describes the report’s data indicator; it does not establish freedom from parameter selection or guarantee equivalent live execution. Neither test is our independently verified result.
What the first buyers say
The two visible reviews, dated 22 and 23 September, praised setup, configuration options and communication. One buyer explicitly said testing would continue and more experience would follow. That is useful feedback on the initial experience, but provides little evidence about performance through different market regimes.

A separate 21 September comment asked the seller for settings. We found no linked public manual or downloadable custom preset in the inspected overview. The listing says its built-in defaults are sufficient to start testing; privately offered profiles should not be assumed to be part of every reseller’s package. These MQL5 opinions are not imported into CheaperForex product ratings.
Practical checks before live use
- Verify the cash risk of the smallest permitted gold lot and the intended stop distance on your account.
- Observe the actual order volume in automatic mode; do not infer a percentage risk from a profile name alone.
- Check the news feed and pause behaviour, including what happens to existing positions during a pause.
- Record slippage, spread and missed entries during demo observation, then compare them with the broker assumptions in the reports.
The strongest reason to consider TitanForge is its explicit individual-trade protection and configurable entry restrictions. The strongest reason to proceed cautiously is the limited monitored trading sample. A longer public history including losing trades would make it easier to assess whether the return profile is repeatable.
Verify it yourself
- Official listing: TitanForge features, original images and customer feedback on MQL5.
- Public account: Titan Forge EA MT5 account and complete trading statistics.
Ready to Buy TitanForge EA MT5?
$239.96 with crypto · $299.95 by card
Official version · Instant download · Free lifetime updates · 7-day money-back guarantee